Poor Marketing Kills Ecommerce Dropshipping
Dropshipping is a good way to source products without much investment. Unfortunately, this seemingly turn-key model has little barrier to entry and thus attracts many competitors with razor-thin margins and no clear way to differentiate.
Yet creating a successful dropshipping business is not impossible, provided the would-be entrepreneur understands the growth and profit challenges.
Dropshipping Boost
I once heard ecommerce dropshipping described as “the perfect business model for anyone who wants all the stress and frustration of running a business without any of the pesky profits to worry about.”
While this description is a little unfair to an industry with estimated sales of $351.8 billion in 2024, according to Oberlo, a dropship provider, it also hints at the benefits of starting or scaling a business.

As a business model, ecommerce dropshipping is attractive for a reason: it is relatively easy to start and very low risk.
There are at least four reasons an entrepreneur might be attracted to dropshipping.
- Little or no investment. There is no need to purchase inventory upfront.
- Low risk. Merchants only pay for products they sell, minimizing the risk.
- Access to products. Stores can offer a variety of products without worrying about storage or investment. When I led ecommerce for a retail chain, we would use drop shippers to add complementary products to our site, boosting average order value.
- Flexibility. Sellers can change product offerings based on market trends without significant financial risk.
All of these features focus on product sourcing and financial investment. The trade-off, however, is a marketing problem.
A Marketing Business
Selling drop-shipped items is a choice to focus on attracting and converting customers rather than developing and sourcing products.
Effectively, when you start or scale a dropshipping business, you prefer solving marketing problems rather than sourcing.
And there will be marketing problems. The top three are likely customer acquisition limits, undifferentiated products, and customer relationships.
Not much CAC
Think for a moment about a traditional retailer that orders products from a manufacturer at wholesale prices, warehouses the items, and sells them for, say, a 25% margin.
Thus, a $100 sale will result in a $25 gross profit. If the retailer wanted a return on advertising spend of 4:1, it could invest $6.25 to acquire a customer — that would be its target customer acquisition cost.
The drop shipping supply chain is longer and more expensive by comparison. More parties take a cut of the profit, and some are taking significant percentages because they carry the inventory risk.
A typical margin for a store selling a drop-shipped item may be as low as 10%, according to Shopify. So, the same $100 sale will result in $10 of margin. A 4:1 ROAS puts this shop’s target CAC at $2.50.
If a retailer and a dropship shop sell identical items — a real possibility — the marketing challenge is clear: the dropship store must acquire customers for less.
Same products
Selling an identical product exacerbates the already anemic CAC. Yet selling the same products is what most dropship-based stores do.
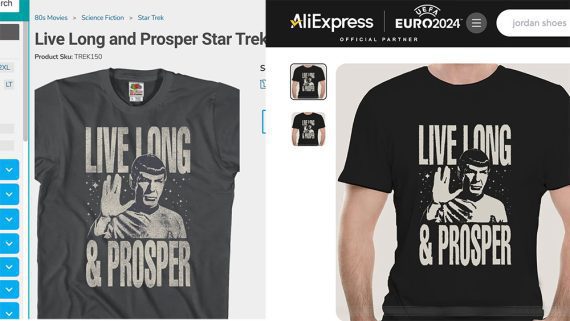
This t-shirt is available on a specialty t-shirt shop, AliExpress, and the Dsers-AliExpress Dropshipping app.
Consider the Dsers-AliExpress Dropshipping, an app for Shopify. The product takes an item from AliExpress and adds it directly to a Shopify store. It will do this for any Shopify store, potentially placing the identical AliExpress item in dozens or even hundreds of shops.
Hence it’s not enough to market a store’s products. Operating an ecommerce dropshipping business requires differentiating from many others.
Customer relationships
Marketing tasks should not end when a sale is consummated. Some of the best tactics focus on retaining and engaging those buyers afterward.
Thus building strong customer relationships is crucial, especially in a dropshipping business where the same products might be available from multiple sources at similar prices.
That means investing time in content marketing, email marketing, retargeting, and social media marketing.