Abandoned Carts Are an Opportunity
Abandoned cart recovery can be a goldmine for ecommerce marketers, but not how one might think.

In 2024, ecommerce shopping cart abandonment rates among U.S. adults hover around 70%, according to the Baymard Institute. It’s a big opportunity.

Baymard suggests focusing on design, noting that “if we focus only on checkout usability issues which we…have documented to be solvable, the average large-sized ecommerce site can gain a 35% increase in conversion rate though better checkout design.”

For the overall U.S. and E.U. ecommerce industry, that 35% increase is about $260 billion in additional revenue.

Beyond Design

The problem is that usability and design haven’t solved abandonment thus far. Ecommerce cart abandonment rates have been essentially flat since 2018 and have risen since 2006.

Ecommerce managers have been unable to solve the shopping cart abandonment problem, or the rate does not have the impact on sales we think it might.

What if shopping cart abandonment is normal for ecommerce, and the real opportunity rests in treating folks who abandon carts like warm leads instead of lost opportunities?

That does not mean that online merchants should ignore design or conversion optimization; rather, it implies an opportunity to market to shoppers who didn’t complete the checkout process.

Cart Recovery Email

A cart abandonment email sequence is perhaps the most popular and effective way to recover the sale. Ecommerce platforms such as Shopify and BigCommerce include those emails as default features.

Familiarity, however, may be a problem. It may be too easy to turn on the feature without optimizing it. A better practice could be identifying the shopper as early as possible and creating an automated behavior-based email to convert.

The steps could be:

  • Capture the shopper’s email address as soon as possible,
  • Understand when to send the first cart recovery email message,
  • Know how many messages the series should include,
  • Optimize and personalize the message content.

Merchants should test and optimize each step for their audience and setup. For example, some marketers send the first recovery email 90 minutes after the abandonment, but others prefer 30 minutes or less.

Retargeting Ads

Another recovery tactic is to retarget cart abandoners with advertising. Retargeting ads should complement the abandonment email series. When the series begins, it should add the shopper to a retargeting campaign. This requires automation to launch a retargeting campaign and then turn it off.

The campaign should run on Google and Meta and in programmatic email via services such as LiveIntent. The goal is to remind shoppers of the abandoned items.

As always, testing and iterating is the key to remarketing success.

Text Messages

After email, the most powerful ecommerce communication tool is text messaging. Text messages are now the preferred transactional communication channel for many shoppers.

A typical online buyer prefers text-based order and shipping notifications. Marketers can use that affinity to remind shoppers via text about abandoned items. Make the message as transactional as possible and avoid repeated messages.

Better Recovery

Since 2006, ecommerce cart abandonment rates have risen from about 59% to 70%, peaking at almost 72% in 2012 with the rise of smartphones before leveling off.

Yet cart abandonment is an opportunity. Without neglecting design, merchants can improve their recovery efforts with coordinated email, retargeting ads, and text messages.

AI Tools for Ideal Customer Profiles

An “ideal customer profile” describes a company’s most valuable prospects, those who find a product or service seemingly perfect for their needs.

Ideal customer profiles help merchants:

  • Select marketing channels,
  • Create ad copy and design,
  • Narrow outreach,
  • Build email sequences,
  • Produce how-to, problem-solving videos.

AI platforms have vast databases of businesses and their audiences, helpful for defining an ideal customer. I tested three platforms for this article.

Custom GPT: ICP Generator

ICP – Ideal Customer Profile Generator,” a custom GPT (available for ChatGPT Plus subscribers), creates profiles based on a URL. I tested it on Smarty Marketing, the site I launched last year. The results were useful, although lacking specifics. My company’s ideal customers per the custom GPT are:

  • In the growth phase: Companies aiming to expand their online presence, increase website traffic, and enhance brand visibility.
  • Digital forward: Businesses that understand and value digital marketing’s impact on growth and are ready to invest in innovative SEO strategies.
  • In competitive markets: Enterprises in industries where online competition is fierce, making them more likely to benefit from unique and effective SEO and link-building strategies.
  • Content creators: Organizations that produce valuable content and can leverage infographic marketing and social media to engage and expand their audience.
  • Seeking long-term results: Businesses focused on building lasting brand awareness and not just short-term gains, aligning with Smarty Marketing’s emphasis on long-term outcomes.

I could continue prompting the custom GPT for the best keywords in organic and paid search campaigns, the best social media platforms, helpful Facebook audience targeting, and so on.

Lemlist

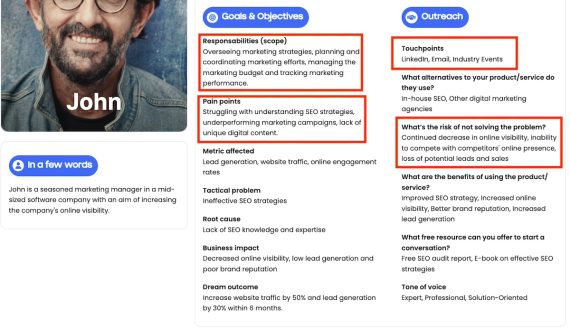
Lemlist builds free ideal customer profiles based on a URL. The profiles are personas with names, demographic details, goals and objectives, and their potential outreach strategies. The reports are useful for ideas and brainstorming. The most helpful sections are:

  • An ideal customer’s responsibilities and pain points,
  • The ideal customer’s most effective marketing channels (“touchpoints”),
  • Risks to ideal customers of not achieving goals.

Lemlist builds free ideal customer profiles based on a URL — with names, demographic details, goals and objectives, and potential outreach strategies. Click image to enlarge.

For example, Lemlist identified my company’s ideal customer as a marketing director (spot-on) with these pain points:

Struggling with understanding organic search strategies, underperforming marketing campaigns, and lack of unique digital content.

And the risks to my ideal customers of not solving problems are:

Continued decrease in online visibility, inability to compete with competitors’ online presence, loss of potential leads and sales.

M1-Project

M1 Project offers various AI-powered marketing tools, including generators for an ideal customer profile and a marketing strategy. Input your URL and M1 Project will:

  • Create a product description,
  • List the problems your products solve,
  • Segment your target audience.

Edit the descriptions, problems, and segments to your business. Then choose your preferred segment, and the tool will create an ideal customer profile. The downloadable document costs $99 and includes the ideal customer’s:

  • Position, income, and pain points,
  • Tools or platforms (potential partners for your business),
  • Publications,
  • Channels frequented,
  • Followed social media accounts.
Online Shoppers Expect More from Sellers

Ecommerce sellers may be delivering a sub-par shopping experience and not even know it, according to a survey of 1,000 American consumers.

The survey from Deloitte Digital in October 2023 is a good reminder of the longstanding gap in how merchants and shoppers perceive the ecommerce experience.

Photo of a male viewing a smartphone screenPhoto of a male viewing a smartphone screen

Online merchants often overestimate customers’ admiration of shopping experiences.

Perception Gap

If the Deloitte Digital survey is accurate, about 80% of brands selling online “believe consumers are impressed by the online shopping experiences they provide. Yet fewer than half of consumers actually are.”

While that may seem shocking, it is not new.

One could argue that there has always been a gap between the perceptions of business leaders and their customers.

For example, a September 2015 Gartner article stated, “Employees are still seeing a vast gulf between the design and usability of the software they use outside work and the software they use in the workplace.”

The article noted that user-friendly consumer software had set new expectations among employees in the workspace.

Accounting and inventory management software are examples. Makers of that software thought the user experience was good; customers (employees) frequently did not.

Scholars and executives have long sought frameworks to identify the gap. Examples include W.E. Deming’s principles of Total Quality Management in Japan during the 1950s, SERVQUAL (assessing “SERVice” and “QUALity”), Six Sigma, and Net Promoter Score.

Why a Gap?

Having acknowledged the perception gap, we can wonder why.

The likely answer is that customer expectations quickly change. L.L.Bean and Amazon reset expectations when they pioneered free shipping. Soon, free shipping was not enough. It also needed to be fast. Then “fast shipping” evolved from five days to two days to one day, and now even the same day in some locations.

Online merchants — or really ecommerce platform developers — that improve the shopping experience set a new standard for their customers, thus the perception gap.

Take Action

The fact that shoppers always seek a better ecommerce experience should spur businesses to action for two reasons.

First, the gap could widen. Ecommerce sellers and platforms that do not meet shoppers’ expectations risk revenue losses or worse.

Second, closing the perception gap is a competitive opportunity. The Deloitte Digital survey found that “customers spend 37% more with brands they find deliver consistent and positive commerce experiences.”

Hence online sellers should regularly measure shoppers’ perceptions and update features accordingly.

Focus on Fundamentals

Taking action, however, does not mean chasing fads. Focus first on the essentials.

The Deloitte Digital survey identified four key ecommerce features where a perception gap exists, suggesting a selling opportunity.

For each of the four “gap” features, Deloitte reported the percentages of ecommerce businesses that believed shoppers were impressed versus the shoppers who agreed.

Ecommerce Feature or Service Brand Perception Shopper Perception
Clear Inventory Availability 77% 54%
Easy Returns / Exchanges 80% 59%
Proactive Delivery Updates 78% 59%
Accurate Search and Discovery 79% 63%

Sellers should research why they overestimate the shopper’s favorable views.

Take “Accurate Search and Discovery,” which had the smallest perception gap in the survey.

A July 2022 report from the Baymard Institute, a customer-experience research firm, noted that 42% of the 133 “major” ecommerce stores it reviewed had site search issues, such as allowing shoppers to search by product type, i.e., a couch versus a chair.

So even a small perception gap creates opportunities to improve.

Profit Boosters from Repeat Buyers

Businesses love new customers, but repeat buyers generate more revenue and cost less to service.

Customers need a reason to return. It could involve inspired marketing, outstanding service, or superior product quality. Regardless, the long-term viability of most ecommerce shops requires folks who purchase more than once.

Here’s why.

Higher Lifetime Value

A repeat customer has a higher lifetime value than one who makes a single purchase.

Say the average order for an online shop is $75. A shopper who buys once and never returns generates $75 versus $225 for a three-time buyer.

Now say the online shop has 100 customers per quarter at $75 per transaction. If just 10 shoppers buy a second time at, again, $75, total revenue is $8,250, or $82.50 each. If 20 shoppers return, revenue is $9,000, or $90 each on average.

Smiling female shopper with many delivery boxes.Smiling female shopper with many delivery boxes.

Repeat customers are really happy.

Better Advertising

Return on advertising spend — ROAS — measures a campaign’s effectiveness. To calculate, divide the revenue generated from the ads by the cost. This measure is often shown as a ratio, such as 4:1.

A shop generating $4 in sales for every ad dollar has a 4:1 ROAS. Thus a business with a $75 customer lifetime value aiming for a 4:1 ROAS could invest $18.75 in advertising to get a single sale.

But $18.75 would drive few customers if competitors spend $21.

That’s when shopper retention and CLV come in. If the store could get 15% of its customers to buy a second time at $75 per purchase, CLV would increase from $75 to $86. An average CLV of $86 with a 4:1 ROAS target means the shop can invest $22 to acquire a customer. The shop is now competitive in an industry with an average acquisition cost of $21, and it can keep new customers rolling in.

Lower CAC

Customer acquisition cost stems from several factors. Competition is one. Ad quality and the channel matter, too.

A new business typically depends on established ad platforms such as Meta, Google, Pinterest, X, and TikTok. The business bids on placements and pays the going rate. Lowering CACs on these platforms requires above-average conversion rates from, say, excellent ad creative or on-site checkout flows.

The scenario differs for a merchant with loyal and presumably engaged customers. These businesses have other options to drive revenue, such as word-of-mouth, social proof, events, and contest marketing. All could have significantly lower CACs.

Reduced Customer Service

Repeat shoppers usually have fewer queries and service interactions. Folks who have purchased a t-shirt are confident about fit, quality, and washing instructions, for example.

These repeat buyers are less likely to return an item — or chat, email, or call a customer service department.

Higher Revenue

Imagine three ecommerce businesses. Each acquires 100 customers per month at $75 per average order. But each has a different customer retention rate.

Shop A retains 10% of its customers each month — 100 total customers in month one and 110 in month two. Shops B and C have a 15% and 20% monthly retention rates, respectively.

Twelve months out, Shop A will have $21,398.38 in sales from 285 shoppers —100 are new and 185 are repeat.

In contrast, Shop B will have 465 shoppers in month 12 —100 new and 365 repeat — for $34,892.94 in sales.

Shop C is the big winner. Retaining 20% of its customers monthly would result in 743 customers in a year and $55,725.63 in sales.

To be sure, retaining 20% of new shoppers is an ambitious goal. Nonetheless, the example shows the compound effects of customer retention on revenue.

Month Shop A: 10% Shop B: 15% Shop C: 20%
Customers Revenue Customers Revenue Customers Revenue
0 100 $7,500.00 100 $7,500.00 100 $7,500.00
1 110 $8,250.00 115 $8,625.00 120 $9,000.00
2 121 $9,075.00 132 $9,918.75 144 $10,800.00
3 133 $9,982.50 152 $11,406.56 173 $12,960.00
4 146 $10,980.75 175 $13,117.55 207 $15,552.00
5 161 $12,078.83 201 $15,085.18 249 $18,662.40
6 177 $13,286.71 231 $17,347.96 299 $22,394.88
7 195 $14,615.38 266 $19,950.15 358 $26,873.86
8 214 $16,076.92 306 $22,942.67 430 $32,248.63
9 236 $17,684.61 352 $26,384.07 516 $38,698.35
10 259 $19,453.07 405 $30,341.68 619 $46,438.02
11 285 $21,398.38 465 $34,892.94 743 $55,725.63

Omnichannel Retail Will Accelerate in 2024

Retail prognosticators have long predicted the convergence of physical and online selling. From the first book sold on Amazon in 1995, there has been a slow blurring of the lines, so to speak, towards multichannel and omnichannel.

Occasionally the change has been abrupt. The pandemic drove demand for buy-online, pick-up in-store services. That triggered the rapid development of software connecting online ordering with brick-and-mortar locations. Post covid, the demand has waned, yet the infrastructure and software remain, representing an omnichannel leap.

Here’s why omnichannel retailing will accelerate in 2024.

Customer Experience

In 2024, the first significant merging of ecommerce and physical retail could be immersive customer experiences.

Augmented reality fitting rooms, interactive displays, and in-store robots are now live in real shopping applications, explained Aron Bohlig, a managing partner at ComCap, an investment bank, in an email.

Photo of someone holding a smartphone with shoes on the screenPhoto of someone holding a smartphone with shoes on the screen

Augmented reality allows shoppers to virtually try on shoes.

The AR or virtual fitting room market could reach $3.17 billion worldwide in 2024, on its way to more than $6 billion by 2027, according to Business Future Analysis, an India-based research firm, in a LinkedIn post.

The investment in virtual fitting rooms is based on at least some initial success. A Shopify Plus case study with the fashion brand Rebecca Minkoff reported that shoppers were “65 percent more likely to place an order after interacting with a product in AR.”

Pop-ups and Partnerships

ComCap’s Bohlig also noted that online brands are experimenting with physical locations, including pop-up shops, experiential events, and partnerships with brick-and-mortar stores.

According to Bohlig, online-first brands want to cultivate direct customer relationships and gather immediate feedback.

Notable examples include:

  • eBay’s “The ’85 Shop” retail pop-up store in Chicago,
  • Shein pop-ups in Los Angeles, Toronto, and Birmingham, U.K.,
  • BarkShop’s live pop-up shop in Manhattan’s SoHo district.

Consumer Outlook

U.S. and global inflation has declined, and consumer confidence has risen since mid-2023.

Nonetheless, some 12.6% of Americans surveyed in December 2023 expected their incomes to decrease in the short term, according to a report from The Conference Board, a nonprofit business think tank, while 18.7%  expect their incomes to increase, up from 17.7% in November.

Hence the U.S. consumer economic outlook is mixed. And consumers’ views of the economy will influence everything from inventory management and pricing strategies to technology investments.

Walmart, for example, will reportedly close as many as 150 underperforming physical locations in 2024, potentially shifting resources toward ecommerce. Walmart’s online sales grew from $25.1 billion in 2019 to $82.1 billion in 2023.

When physical retailers prioritize ecommerce, and vice versa, they can allocate resources for maximum profits.

Shopper Behavior

More than half of American shoppers (54%) use search engines to research purchase decisions, according to an April 2023 survey from eMarketer. And 43% search the Amazon marketplace and other retailers’ websites for products.

The same eMarketer report projects ecommerce to represent 20.6% of total U.S. retail sales by 2027.

Bottom line, most shopping journeys start online now and even more moving forward. Expect physical retailers to hasten online experiences in 2024.

Organizational Structure

A final milestone on the path toward omnichannel selling is the organizational structure of retail businesses.

A decade ago, most ecommerce functions at large retailers were nestled in the information technology or marketing departments. Managers of in-store operations reported to different executives than their ecommerce counterparts.

Those siloes have changed.

Ecommerce and brick-and-mortar managers now typically report to the same retail operations execs. This leads to daily collaborations and a unified sales channel — true omnichannel retailing.

How to Break Even on Customer Acquisition

Last year I reported my research showing that brands on average lost $29 for every customer acquired — up 222% in a decade. The size of the loss spotlights the dual importance of subsequent sales to recoup the initial costs while replacing the 40% customer churn in some sectors.

Can merchants lower the acquisition cost to breakeven on the first sale or even a profit? Is making an initial profit the right goal?

For most brands, getting close to breakeven is good enough. Brand shouldn’t aim to turn an initial profit as it suggests too-low spending on acquisition, hampering growth. Certainly there are exceptions, such as brands with $1,000 average cart values, but breakeven should be the goal for most.

Acquisition Math

Say your average order is $100, product cost is $50, and shipping and handling is $32. That leaves a gross margin of $18. But if the acquisition cost is $35, you’re losing $17 for every acquired customer.

Reducing the CAC to around $18 gets to the magical first-order breakeven, likely from three levers:

  • Cut advertising costs,
  • Increase advertising performance, or
  • Increase the margin from first-time buyers.

Let’s look at all three.

Cut advertising cost

Strategies for cutting ad costs include targeting lesser-known audiences and even shifting to direct mail. Neither is perfect. Smaller audiences rarely move the overall conversion needle. And direct mail effectiveness for acquisition is hit and miss depending on the product, list quality, and timing.

Social media is where consumers hang out and thus the top acquisition channel for brands. The competition to reach those consumers will likely increase. The explosion of AI-generated content has already reduced organic search traffic to many ecommerce brands. The coming launch of Google’s Search Generative Experience could reduce it even more. Thus brands that relied on traffic from Google could migrate to social, driving up ad costs.

Increase advertising performance

Within the advertising acquisition process of “creative,” “targeting,” “landing,” and “conversion,” targeting is more restrictive owing to increasing privacy rules. Conversion optimization continues to improve, but only incrementally.

That leaves creative and landing as the routes to focus on. Sometimes creative is called “the new targeting” because of the impact influencers can bring with their followers. And landing is “the new conversion” because the experiences — what consumers see in a promotion versus what’s on the advertiser’s website — are invariably poor.

Increase first-order margin

Increasing margin materially typically requires changing the product mix or elevating average order values. The latter is easier and more realistic for most merchants.

And the best way to increase acquisition AOV is to get first-time buyers to explore the brand more widely. It’s the antithesis of a product detail or landing page where the focus is a single product with minimal distractions.

Yet an approach of discovery that encourages new shoppers to explore the brand and adjacent categories is a proven winner. Direct your merchandising on what visitors typically buy first, and couple it with a minimum order value free shipping offer. The result is higher AOVs.

That tactic alone can fundamentally change the economics of an ecommerce business.

Are Cross-selling and Personalization Now the Same?

Ecommerce product-recommendation technology is blurring the lines among merchandising techniques, making it difficult to know cross-selling from personalization.

We are in the midst of a software revolution. Machine learning and, especially, generative artificial intelligence have gone from the realm of data scientists to the commonplace in what feels like barely a year, and these technologies are changing how ecommerce websites work.

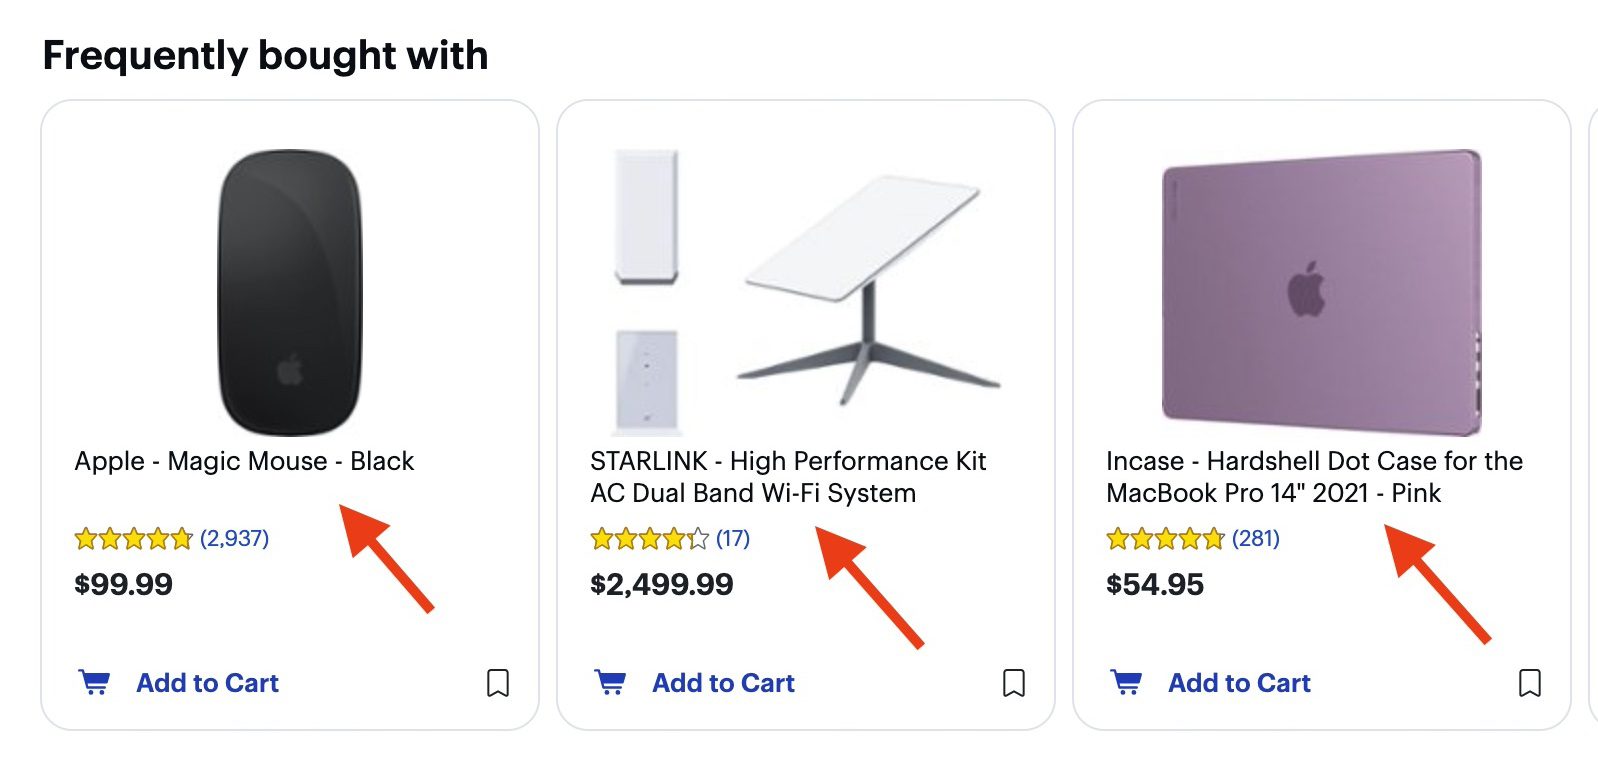
This “Frequently bought with” section on BestBuy.com is an example of cross-selling. It appeared on the lower section of a MacBook Pro product page. Click image to enlarge.

AI Everywhere

Since ChatGPT was released on November 30, 2022, generative AI has become so ordinary that it can be found in almost every online editor, app, or search result. It has even made its way into ecommerce product recommendations, with the bleeding-edge AI tools on the cusp of adjusting the copy used to describe a product to match what it knows about a shopper’s navigation history.

This level of personalization is amazing. But does it change what it means to merchandise an ecommerce store? If every recommendation, every part of navigation, and even the products shown as the result of a search are AI-personalized and manipulated, does cross-selling have meaning?

To answer, consider how cross-selling and ecommerce personalization were defined before the widespread use of machine learning and AI.

Ecommerce Cross-selling

Cross-selling is a merchandising technique wherein a website offers shoppers complementary items as they navigate and visit product detail pages.

Classic examples are offering batteries with electronics or a case with a laptop computer. Thus ecommerce cross-selling often makes suggestions based on items frequently purchased together or what may logically complement the primary product.

Even before AI’s rise, cross-selling suggestions could be tailored to the individual’s interests or behavior.

Cross-selling was usually in a “frequently also bought with” section low on a product detail page or during the checkout process.

From the merchant’s perspective, cross-selling aims to increase the average order value by encouraging customers to buy more during a single transaction.

Ecommerce Personalization

Personalization changes the shopping experience to suit an individual customer. Ecommerce personalization is based on that shopper’s unique preferences, past behavior, and data.

While most marketers employ personalization to boost profit, the tactic should make a shopper feel understood and valued. Customers who are happy and comfortable with the buying journey will likely purchase repeatedly and, therefore, have a relatively higher lifetime value.

Personalization requires data collection and analysis. It then uses algorithms and AI to understand customer behavior patterns, preferences, and potential needs. Personalization can manifest anywhere on an ecommerce site, including navigation, category pages, search results pages, and product detail pages.

Overlap

Cross-selling and ecommerce personalization both require analytics, although personalization relies on a deeper analysis. And cross-selling can be a form of personalization when the recommendations are based on individual user data.

The better AI becomes, the more blurry the line, although one might argue that cross-selling is more transactional, focusing on increasing the immediate value of a purchase, while personalization is about fostering a long-term relationship.

Contrasts

An increase in average order size can measure the success of cross-selling. In contrast, many or most ecommerce marketers measure personalization over time through metrics such as customer retention rates, repeat purchase rates, and lifetime value.

Thus cross-selling can be seen as a point-of-sale strategy, while personalization is a comprehensive approach that influences every interaction with the customer.

AI Takeover

AI-powered ecommerce recommendation software circa 2023 already powers both cross-selling and personalization for many or even most online stores. From an ecommerce merchandiser’s perspective, there’s little difference between the two.

So why even bother making a distinction? It is this.

  • Different metrics. While both cross-selling and ecommerce personalization aim to improve the shopping experience and boost revenue, the techniques operate on different principles and have different metrics.
  • Single-order vs. overall relationship. Cross-selling increases the value of a single order, and personalization deepens the customer relationship over time.
  • Mix of both. An effective ecommerce strategy often combines both, leveraging their unique advantages to maximize immediate and long-term gains.

Marketers should not put on-site merchandising on auto-pilot and permit an AI to take over. Doing so could have short-term benefits, but when every ecommerce shop has AI running personalization, personalization will no longer be a competitive advantage.

In fact, the more automatic algorithms and AI become, the more important is the art of marketing — as opposed to the science of it.

Understanding the nuance of cross-selling versus personalized product recommendations could lead one to know that cross-selling should not be personalized in some cases.

It is still a good idea to offer batteries with a toy car that needs them or a case with a laptop computer than it is to offer something completely unrelated based on behavior.

Ecommerce Companies Need Flywheels

The formula for ecommerce growth seems simple: Get more customers. Sell more items. Earn more profit. Repeat.

It’s an approach that industry giants have nearly perfected. Amazon’s Jeff Bezos used this concept to develop a growth strategy, intertwining customer experience, traffic, and massive selection into a self-reinforcing cycle.

Bezos’ virtual cycle — akin to a flywheel — showcased how structured repetition can lead to enormous success. And that flywheel is a pattern businesses can tap into, refining and repeating processes to scale up consistently.

What’s more, not every flywheel has to be about growth. A company can have many flywheels spinning at various levels of the business.

The Flywheel Concept

The flywheel has its roots in mechanical engineering, where a heavy rotating disc stores and releases energy. In the business context, the term describes a strategy where inputs, over time, lead to amplified outcomes.

Sketch and design of a flywheel on paperSketch and design of a flywheel on paper

The initial flywheel effort might not produce much, but momentum builds, and soon the flywheel spins effortlessly.

In his book “Good to Great,” Jim Collins introduced this metaphor for sustained business success. The initial effort put into a flywheel returns sparse results. But momentum gathers with persistence. Each turn of the wheel becomes both easier and more impactful.

A flywheel is about accelerating growth, departing from the traditional business funnel focusing on linear processes. Each flywheel effort feeds into the next stage, creating a positive feedback loop that fosters consistent progress.

Businesses operate multiple flywheels, from company-wide tactics to niche components such as advertising or customer experience. Each has its inputs and momentum-builders, but the underlying principle remains the same.

Understanding and harnessing the power of these flywheels can be the difference between an average business and one that thrives.

Flywheel in Action

Consider an ecommerce advertising flywheel created to achieve a 3:1 return on ad spend within 180 days after an initial purchase.

Targeted advertising

  • Action. Target ads at specific demographic or psychographic audiences, optimizing for conversions.
  • KPIs. Measure click rate, cost per click, and conversion rate.
  • Momentum builder. Refine the audience targeting with each (or nearly each) rotation. The ads become more effective as you understand which audiences convert.

Optimized landing and checkout experiences

  • Action. Streamline conversions from the ads’ landing page to the final purchase, minimizing friction at each step.
  • KPIs. Bounce rate, average session duration, and cart abandonment rate.
  • Momentum builder. Continuous optimization leads to higher conversion rates, driving revenue.

Post-purchase engagement

  • Action. Connect with customers via emails, text messaging, or retargeting ads to promote related products or gather feedback.
  • KPIs. Open rate, click rate, and repeat purchase rate.
  • Momentum builder. Engaged customers often are repeat buyers. Their feedback can improve products and processes.

Reorder incentives

  • Action. Offer deals or discounts to encourage repeat purchases or subscription signups.
  • KPIs. Customer lifetime value and repeat purchase rate.
  • Momentum builder. Increased reorder rates boost customers’ overall value, leading to more stable revenue.

Feedback and referral campaigns

  • Action. Encourage customers to leave reviews and refer friends, perhaps with incentives.
  • KPIs. Net promoter score and referral conversion rate.
  • Momentum Builder. Positive reviews and word-of-mouth referrals attract new customers at little to no acquisition cost. This puts folks in the flywheel without an ad, which is no problem — flywheels don’t have to be linear.

Retargeting non-converters

  • Action. Run targeted campaigns for folks who visited but didn’t purchase.
  • KPIs. Retargeting conversion rate.
  • Momentum builder. Converting even a fraction of these visitors leads to significant revenue, making advertising more efficient over time. And it doesn’t matter that some shoppers arrive at a different spot in the cycle.

A good ecommerce marketer might have done these steps regardless. But connecting them sets in motion a dynamic flywheel.

Each stage’s outcomes feed the next, fostering rhythmic, increasing growth.

Building Flywheels

How do ecommerce businesses craft flywheels that turn and gather momentum with each rotation?

  1. Identify core drivers. Pinpoint what drives success or solves the problem. If it is a return policy flywheel, determine what reduces product returns.
  1. Map the cycle. Visualize how one positive outcome can lead to another in a given flywheel.
  1. Integrate information loops. Successful flywheels run on facts, not assumptions. Ensure there’s a system in place to gather feedback and collect data —  from customers, analytics, and internal teams. This info refines and accelerates the virtuous cycle.
  1. Iterate relentlessly. The first version of the flywheel won’t be perfect. The idea is to refine continuously. Tweak and adapt as the market shifts, customer preferences evolve, and challenges arise.
  1. Invest in sustained effort. Early results might be minimal, but sustained effort ensures momentum over time.
  1. Educate your team. A flywheel is a mindset, not a strategy. Ensure all team members understand its significance and their role. The flywheel moves faster when all participants push in the same direction.

As ecommerce becomes increasingly competitive, the need for growth strategies becomes paramount. Flywheels offer a path, where each success propels the next.

11 Post-purchase Retention Tactics

Retaining customers is easier and cheaper than securing new ones. Plus, happy customers refer friends and family.

Here are 11 post-purchase tactics to prompt customers to return and encourage others.

Post-purchase Retention Tactics

Instant purchase confirmations. A notification delivered to customers over their preferred communication method — email or text — puts them at ease. Provide anticipated production and delivery times if the items won’t ship immediately, And include links to frequently asked questions and customer service.

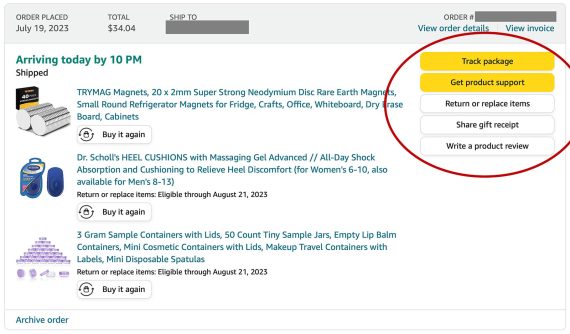
Timely and clickable tracking notifications. Customers want to know the status of their order. Informing them that it’s shipped and providing a means to track its progress is crucial. Provide status and tracking details via email or text and in their order history on the website. Ensure tracking numbers are linked to the shipment status page at the carrier’s site or yours.

Amazon order tracking and updating page, where customers can also submit returns, write product reviews, and more.Amazon order tracking and updating page, where customers can also submit returns, write product reviews, and more.

Amazon makes it easy for customers to track shipments and get product support.

Self-help customer service. Help customers get immediate answers with a simple and distraction-free FAQ page. Use tailored links directly to a customer’s account or order history when necessary.

A direct line to customer service. Provide multiple ways for customers to contact you. Phone and email methods work, but live chat and social messaging are better. Consider dedicated channels for returning buyers.

Make it easy to modify, cancel, or delay an order. Mistakes happen and needs change. Forcing customers to jump through hoops to alter their orders can cost you long-term. Take a cue from Amazon, which allows customers to edit and cancel orders until packed and shipped.

Simplify returns and exchanges. Make it simple for customers to return and exchange items. Eliminate delays with a self-initiated return feature. Once received, log and process replacement orders and refunds quickly.

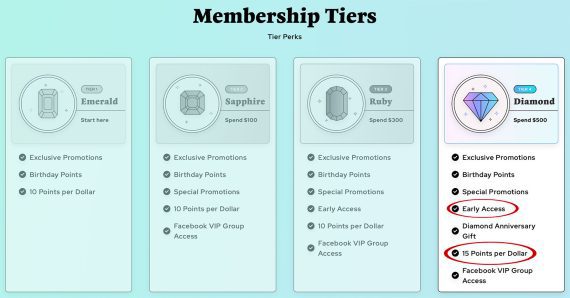
Host a loyalty program. Reward returning buyers via store credits, gift cards, or products. Offer additional benefits based on total spending within a given period. For example, Diamond Art Club’s VIP program features four tiers, with the highest gaining early access to new kits and more points per dollar spent.

Diamond Art Club VIP Membership teirs listing all the benefitsDiamond Art Club VIP Membership teirs listing all the benefits

Rewards’ incentives entice shoppers to keep coming back. Source: Diamond Art Club.

Personalized email, text, and social media campaigns. Personalized information and recommendations do wonders. Rely on behavioral data — activity, wish lists, purchases — to map out which customers receive which content.

Ask for honest feedback. Send post-purchase surveys and requests for honest reviews, explaining how their feedback helps shape the brand’s future. Personalize your asks so they know you are listening.

Account profile options. Take personalization up a notch by asking loyal customers to provide details about themselves for better recommendations. For example, knowing a customer’s favorite holiday or color helps with messaging at different times of the year. Offer additional loyalty points for updating their profile.

Encourage user-generated content. Entice customers to generate content you can showcase. Photos and videos showing your product in use drive sales and make customers feel worthy. Encouraging helpful UGC requires a two-pronged approach: personalized email campaigns and a hashtag for social media.

Drive Customer Satisfaction with NPS

Repeat purchases and average order value gauge customers’ satisfaction. But the gold standard is Net Promoter Score.

NPS measures the likelihood of customers recommending a company or product to others. It’s a quick, easy metric, used widely across industries and verticals. The simplicity facilitates benchmarks and easy comparisons to monitor performance over time and against competitors.

To find the NPS, ask customers to rate the prospect of recommending your company on a scale of 0 to 10  —  “Not at all likely” to “Extremely likely.” The question is simple:

On a scale of 0 to 10, how likely are you to recommend [Company/Product/Service] to a friend or colleague?

The results group respondents as “Detractors” (scoring 0-6), “Passives” (7-8), or “Promoters” (9-10).

Group respondents as “Detractors,” “Passives,” or “Promoters.”

Calculating NPS

Promoters are highly satisfied, your most loyal customers. Passives are moderately satisfied but not necessarily enthusiastic. They may recommend your business if asked but can be tempted by competitors. Detractors are dissatisfied customers who are unlikely to buy again and could speak negatively about a business.

To calculate your NPS score, ignore the Passives and subtract the percentage of Detractors from the percentage of Promoters, as follows:

NPS = % Promoters – % Detractors

For example, if 60% of respondents are Promoters and 20% are Detractors, the NPS would be 40 (60 – 20).

Scores can range from -100 to +100. In my experience, a poor NPS ranges from -100 to -1. It means the business has a higher percentage of Detractors than Promoters.

An average NPS ranges from 0 to 30, indicating a mix of Promoters, Detractors, and Passives. A good score runs 31 to 70 — many satisfied and loyal customers. Finally, an excellent score is anything over 70. This is rare and reflects exceptional customer products and service.

No matter the score, there is always room for improvement. Use NPS as a yardstick; track progress with always-on surveys. Ask follow-up questions where appropriate for customers to explain their scores. These details can pinpoint what drives satisfaction and frustration, highlighting areas of focus.

Using NPS in this way drives a customer-focused culture of continuous improvement. The result is reduced churn and positive word of mouth.

More Is Better

A larger sample size will always produce more reliable results. However, a few hundred responses are often enough for broad conclusions. Offering an incentive, such as an entry for a free prize, can spur responses. And don’t forget to seek Promoters’ permission to publish their content in your marketing materials.