The official documentation for how Core Web Vitals are scored was recently updated with new insights into how Interaction to Next Paint (INP) scoring thresholds were chosen and offers a better understanding of Interaction To Next Paint.
Interaction to Next Paint (INP)
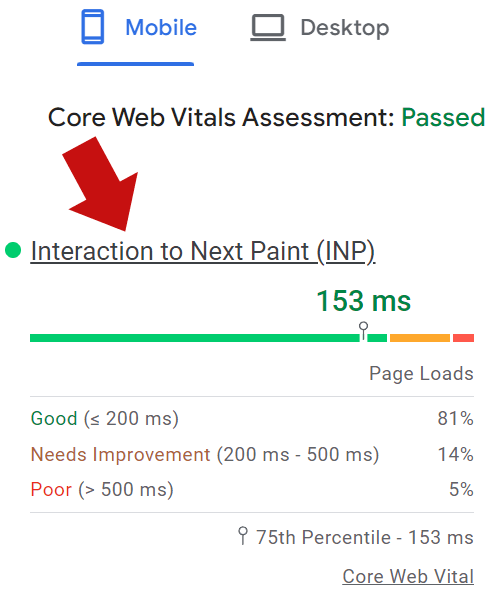
Interaction to Next Paint (INP) is a relatively new metric, officially becoming a Core Web Vitals in the Spring of 2024. It’s a metric of how long it takes a site to respond to interactions like clicks, taps, and when users press on a keyboard (actual or onscreen).
“INP observes the latency of all interactions a user has made with the page, and reports a single value which all (or nearly all) interactions were beneath. A low INP means the page was consistently able to respond quickly to all—or the vast majority—of user interactions.”
INP measures the latency of all the interactions on the page, which is different than the now retired First Input Delay metric which only measured the delay of the first interaction. INP is considered a better measurement than INP because it provides a more accurate idea of the actual user experience is.
INP Core Web Vitals Score Thresholds
The main change to the documentation is to provide an explanation for the speed performance thresholds that show poor, needs improvement and good.
One of the choices made for deciding the scoring was how to handle scoring because it’s easier to achieve high INP scores on a desktop versus a mobile device because external factors like network speed and device capabilities heavily favor desktop environments.
But the user experience is not device dependent so rather that create different thresholds for different kinds of devices they settled on one metric that is based on mobile devices.
The new documentation explains:
“Mobile and desktop usage typically have very different characteristics as to device capabilities and network reliability. This heavily impacts the “achievability” criteria and so suggests we should consider separate thresholds for each.
However, users’ expectations of a good or poor experience is not dependent on device, even if the achievability criteria is. For this reason the Core Web Vitals recommended thresholds are not segregated by device and the same threshold is used for both. This also has the added benefit of making the thresholds simpler to understand. Additionally, devices don’t always fit nicely into one category. Should this be based on device form factor, processing power, or network conditions? Having the same thresholds has the side benefit of avoiding that complexity.
The more constrained nature of mobile devices means that most of the thresholds are therefore set based on mobile achievability. They more likely represent mobile thresholds—rather than a true joint threshold across all device types. However, given that mobile is often the majority of traffic for most sites, this is less of a concern.”
These are scores Chrome settled on:
Scores of under 200 ms (milliseconds) were chosen to represent a “good” score.
Scores between 200 ms – 500 ms represent a “needs improvement” score.
Performance of over 500 ms represent a “poor” score.
Screenshot Of An Interaction To Next Paint Score
Lower End Devices Were Considered
Chrome was focused on choosing achievable metrics. That’s why the thresholds for INP had to be realistic for lower end mobile devices because so many of them are used to access the Internet.
They explained:
“We also spent extra attention looking at achievability of passing INP for lower-end mobile devices, where those formed a high proportion of visits to sites. This further confirmed the suitability of a 200 ms threshold.
Taking into consideration the 100 ms threshold supported by research into the quality of experience and the achievability criteria, we conclude that 200 ms is a reasonable threshold for good experiences”
Most Popular Sites Influenced INP Thresholds
Another interesting insight in the new documentation is that achievability of the scores in the real world were another consideration for the INP scoring metrics, measured in milliseconds (ms). They examined the performance of the top 10,000 websites because they made up the vast majority of website visits in order to dial in the right threshold for poor scores.
What they discovered is that the top 10,000 websites struggled to achieve performance scores of 300 ms. The CrUX data that reports real-world user experience showed that 55% of visits to the most popular sites were at the 300 ms threshold. That meant that the Chrome team had to choose a higher millisecond score that was achieveable by the most popular sites.
The new documentation explains:
“When we look at the top 10,000 sites—which form the vast majority of internet browsing—we see a more complex picture emerge…
On mobile, a 300 ms “poor” threshold would classify the majority of popular sites as “poor” stretching our achievability criteria, while 500 ms fits better in the range of 10-30% of sites. It should also be noted that the 200 ms “good” threshold is also tougher for these sites, but with 23% of sites still passing this on mobile this still passes our 10% minimum pass rate criteria.
For this reason we conclude a 200 ms is a reasonable “good” threshold for most sites, and greater than 500 ms is a reasonable “poor” threshold.”
Barry Pollard, a Web Performance Developer Advocate on Google Chrome who is a co-author of the documentation, added a comment to a discussion on LinkedIn that offers more background information:
“We’ve made amazing strides on INP in the last year. Much more than we could have hoped for. But less than 200ms is going to be very tough on low-end mobile devices for some time. While high-end mobile devices are absolute power horses now, the low-end is not increasing at anywhere near that rate…”
A Deeper Understanding Of INP Scores
The new documentation offers a better understanding of how Chrome chooses achievable metrics and takes some of the mystery out of the relatively new INP Core Web Vital metric.
Google published a proposal in the Schema.org Project GitHub instance that proposes proposing an update at Schema.org to expand the shopping structured data so that merchants can provide more shipping information that will likely show up in Google Search and other systems.
Shipping Schema.org Structured Data
The proposed new structured data Type can be used by merchants to provide more shipping details. It also suggests adding the flexibility of using a sitewide shipping structured data that can then be nested with the Organization structured data, thereby avoiding having to repeat the same information thousands of times across a website.
The initial proposal states:
“This is a proposal from Google to support a richer representation of shipping details (such as delivery cost and speed) and make this kind of data explicit. If adopted by schema.org and publishers, we consider it likely that search experiences and other consuming systems could be improved by making use of such markup.
This change introduces a new type, ShippingService, that groups shipping constraints (delivery locations, time, weight and size limits and shipping rate). Redundant fields from ShippingRateSettings are therefore been deprecated in this proposal.
As a consequence, the following changes are also proposed:
some fields in OfferShippingDetails have moved to ShippingService; ShippingRateSettings has more ways to specify the shipping rate, proportional to the order price or shipping weight; linking from the Offer should now be done with standard Semantic Web URI linking.”
The proposal is open for discussion and many stakeholders are offering opinions on how the updated and new structured data would work.
For example, one person involved in the discussion asked how a sitewide structured data type placed in the Organization level could be superseded by individual products had different information and someone else provided an answer.
A participant in the GitHub discussion named Tiggerito posted:
“I re-read the document and what you said makes sense. The Organization is a place where shared ShippingConditions can be stored. But the ShippingDetails is always at the ProductGroup or Product level.
This is how I currently deal with Shipping Details:
In the back end the owner can define a global set of shipping details. Each contains the fields Google currently support, like location and times, but not specifics about dimensions. Each entry also has conditions for what product the entry can apply to. This can include a price range and a weight range.
When I’m generating the structured data for a page I include the entries where the product matches the conditions.
This change looks like it will let me change from filtering out the conditions on the server, to including them in the Structured Data on the product page.
Then the consumers of the data can calculate which ShippingConditions are a match and therefore what rates are available when ordering a specific number of the product. Currently, you can only provide prices for shipping one.
The split also means it’s easier to provide product specific information as well as shared shipping information without the need for repetition.
Your example in the document at the end for using Organization. It looks like you are referencing ShippingConditions for a product that are on a shipping page. This cross-referencing between pages could greatly reduce the bloat this has on the product page, if supported by Google.”
The Googler responded to Tiggerito:
“@Tiggerito
The Organization is a place where shared ShippingConditions can be stored. But the ShippingDetails is always at the ProductGroup or Product level.
Indeed, and this is already the case. This change also separates the two meanings of eg. width, height, weight as description of the product (in ShippingDetails) and as constraints in the ShippingConditions where they can be expressed as a range (QuantitativeValue has min and max).
In the back end the owner can define a global set of shipping details. Each contains the fields Google currently support, like location and times, but not specifics about dimensions. Each entry also has conditions for what product the entry can apply to. This can include a price range and a weight range.
When I’m generating the structured data for a page I include the entries where the product matches the conditions.
This change looks like it will let me change from filtering out the conditions on the server, to including them in the Structured Data on the product page.
Then the consumers of the data can calculate which ShippingConditions are a match and therefore what rates are available when ordering a specific number of the product. Currently, you can only provide prices for shipping one.
Some shipping constraints are not available at the time the product is listed or even rendered on a page (eg. shipping destination, number of items, wanted delivery speed or customer tier if the user is not logged in). The ShippingDetails attached to a product should contain information about the product itself only, the rest gets moved to the new ShippingConditions in this proposal. Note that schema.org does not specify a cardinality, so that we could specify multiple ShippingConditions links so that the appropriate one gets selected at the consumer side.
The split also means it’s easier to provide product specific information as well as shared shipping information without the need for repetition.
Your example in the document at the end for using Organization. It looks like you are referencing ShippingConditions for a product that are on a shipping page. This cross-referencing between pages could greatly reduce the bloat this has on the product page, if supported by Google.
Indeed. This is where we are trying to get at.”
Discussion On LinkedIn
LinkedIn member Irina Tuduce (LinkedIn profile), software engineer at Google Shopping, initiated a discussion that received multiple responses that demonstrating interest for the proposal.
Andrea Volpini (LinkedIn profile), CEO and Co-founder of WordLift, expressed his enthusiasm for the proposal in his response:
“Like this Irina Tuduce it would streamline the modeling of delivery speed, locations, and cost for large organizations
“I already gave my feedback on the naming conventions to schema.org which they implemented. My concern for Google is how exactly merchants will get this data into the markup. It’s nearly impossible to get exact shipping rates in the SD if they fluctuate. Merchants can enter a flat rate that is approximate, but they often wonder if that’s acceptable. Are there consequences to them if the shipping rates are an approximation (e.g. a price mismatch in GMC disapproves a product)?”
Inside Look At Development Of New Structured Data
The ongoing LinkedIn discussion offers a peek at how stakeholders in the new structured data feel about the proposal. The official Schema.org GitHub discussion not only provides a view of how the proposal is progressing, it offers stakeholders an opportunity to provide feedback for shaping what it will ultimately look like.
With hindsight, the previous epoch could be called “The Age of the One-Trick Pony.” It began back in 2002 when Google passed more than a dozen crawlers and directories to become the dominant search engine.
If you learned how to improve a website’s visibility in Google’s natural or unpaid search results, then you could get a respectable job as a search engine optimizer.
Going forward, SEO specialists will need to invest more time in learning four additional disciplines: digital analytics, digital advertising, content marketing, and social media marketing.
SEO managers will also need to demonstrate critical thinking about digital marketing strategy if they ever hope to climb the ladder.
So, where should you begin?
Digital Analytics
You should start by learning more about digital analytics, which is the process of collecting, measuring, analyzing, and interpreting data from digital sources to understand how users interact with online content.
This will help you understand why traditional metrics like “keyword rankings” and “organic pageviews” – which are the top two performance metrics that SEO professionals use to measure success in 2024 – aren’t getting noticed anymore. This means they’re never going to help you get a promotion, let alone a seat at the big table.
“Keyword rankings and pageviews are not necessarily relevant to business goals. They’re the main metrics being disrupted right now, but it’s critical to lean into disruption to discover opportunities and change strategies.”
He used a clickstream panel from Datos to tackle a couple of critical questions:
What typically occurs after Americans and Europeans perform a Google search?
In 2024, what percentage of searches end without any clicks?
As the twin charts below indicate, close to 60% of Google searches result in zero clicks, while slightly more than 40% result in a click.
Image from Sparktoro, September 2024
Of the searches that result in a click, about 25-30% go to platforms that Google owns, including YouTube, Google Images, Google Maps, and Google News. Meanwhile, the other 70% to 75% go to a non-Google-owned, non-Google-ad-paying property.
For every 1,000 Google searches, only 360 clicks in the U.S. and just 374 clicks in Europe go to the open web.
That is why you should use digital analytics to measure the impact of visibility in Google’s natural or unpaid search results on raising brand awareness.
In the late 1980s, I was the director of corporate communications at Lotus Development Corporation and at Ziff-Davis during the 1990s. Back then, I began utilizing surveys to measure the impact of publicity on brand awareness.
Today, you can use a modified version of brand lift surveys to measure this KPI.
Brand lift surveys ask people questions about your brand and products – either before and after your target audience has been exposed to a new campaign or at regular intervals.
The questions can help you understand how your SEO efforts and other cross-channel programs are impacting your brand, including:
Awareness.
Consideration.
Favorability.
Purchase intent.
In other words, learning to use digital analytics to measure, analyze, and interpret data is significantly more valuable to your career than just using the same old web analytics metrics that SEO pros have been collecting and reporting for more than 20 years.
Digital Advertising
Next, I would recommend learning more about digital advertising, which includes pay-per-click (PPC) advertising.
Digital ads can appear in many forms, including text, images, audio, and video, and can be found on various platforms, such as search engines, social media, and websites.
You’re probably sharing your keyword research with colleagues in your advertising department or over at your ad agency. But that is just the front end of a longer process – you should learn more about the middle and back end, too.
For example, I had bet dollars to donuts that your colleagues in advertising are busy setting up audiences in Google Analytics 4, which lets them segment users in ways that are important to your business.
By linking your GA4 account to Google Ads, they can remarket to them.
Why does this represent a strategic opportunity for SEO pros?
“People don’t make decisions in a neat, linear fashion.”
Between the moment they realize they need or want something and the moment they make a purchase, a lot happens.
The research also found:
“People look for information about a category’s products and brands, and then weigh all the options.”
They go through two different mental modes in the messy middle: exploration, which is an expansive activity, and evaluation, which is a reductive activity.
It concluded:
“Whatever a person is doing, across a huge array of online sources, such as search engines, social media, and review sites, can be classified into one of these two mental modes.”
So, how do SEO professionals harness this insight?
What if you started building “SEO audiences” in GA4 to help people in the “messy middle” of their purchase journey?
You could then share your SEO audiences with your colleague in advertising, who could then create a remarketing campaign targeted at this specific group of users – and help them complete their purchase journey.
For example, if your SEO program builds an audience of 1,000 users who:
Begin the checkout process, then your colleague could use Google Ads to ask them to make a purchase.
Download a white paper, then your colleague could use Google Ads to ask them to complete a registration form.
Scroll to 90% of a blog post or article, then your colleague could use Google Ads to ask them to subscribe to a newsletter.
SEJ’s State of SEO 2025 says the biggest barrier to SEO success in the last 12 months was “budget and resources.” And that was followed by two other traditional barriers: “Google algorithm updates” and “competition in SERPs.”
But if you dig a little deeper, the fourth item on the list of the biggest barriers to SEO success was “alignment with other departments.”
So, imagine what would happen if the SEO and PPC people started working together to help people in the “messy middle” of their purchase journey?
Content Marketing, Social Media Marketing, And SEO
Speaking of alignment with other departments, SEO pros need to learn even more than they already know about content marketing and social media marketing.
Overlapping responsibilities can be a waste of time and frustrating for teams. So, these tend to be the first things that companies and clients trim when they tighten their purse strings.
Ironically, slightly overlapping roles can improve workflow integration. This is because each role’s activities impact the next process in the workflow.
Alignment with other departments isn’t just a way to keep your SEO budget and resources from being cut. It is also a way to overcome other barriers to SEO success, like “Google algorithm updates” and “competition in SERPs.”
The article by Kevin Indig dives into the latest data on AI Overviews (AIO) to understand domain visibility, citation trends, and effective search strategies crucial for SEO success.
What does he notice? The top three most cited domains in AIOs are:
YouTube.com.
Wikipedia.com.
LinkedIn.com.
What does he wonder?
“The fact that two social networks, YouTube and LinkedIn, are in the top three most cited domains raises the question of whether we can influence AIO answers with content on YouTube and LinkedIn more than our own.”
Indig also notes that videos take more effort to produce than LinkedIn answers, but videos might also be more defensible against copycats. So, “AIO-optimization strategies should include social and video content.”
Let us imagine that you are the SEO manager at a Fortune 500 company. What would happen if your chief marketing officer (CMO) decided to create a task force to develop AIO-optimization strategies?
If the task force included managers from the SEO, content marketing, and social media marketing departments, then how likely is it that you would be selected to head up this team?
Since then, SEJ’s State of SEO 2025 confirms that 46.3% of SEO professionals are “content goblins,” a term that the author coined to describe people “willing to eschew rules, morals, and good taste in exchange for eyeballs and mountains of cash.”
Another 25.2% of SEO pros are “alligator wrestlers,” another term coined by The Verge to describe the link spammers who want people to click on “WATCH: 10-foot Gator Prepares to Maul Digital Marketers.”
And 19.6% were confused by these descriptions, which indicates that they don’t get out of their silos very often.
So, how do you avoid the stereotype that SEO pros are hustlers, while simultaneously demonstrating that you have the education, expertise, and experience needed to lead an interdisciplinary team?
But you’d probably improve your chances of getting the new position by also reading:
In other words, the more you know about content marketing and social media marketing, the more likely it is that you will be chosen to head up a task force to develop AIO-optimization strategies.
And working collaboratively with other departments to leverage YouTube, LinkedIn, and cross-channel strategies will also increase your odds of getting promoted in the foreseeable future.
Digital Marketing Strategy
But when you climb the corporate ladder, don’t be surprised if your next job title doesn’t include the term “search engine optimization” or “SEO.”
“Over the last 18 months there has been a marked decline in the job market for senior SEO leadership roles across in-house and agency landscapes, and this trend is persisting.”
And he wondered:
“Maybe companies don’t believe SEO by itself is enough anymore. Job seekers need SEO plus something extra.”
As I mentioned earlier, the era of one-trick ponies is about to end. What comes next can only be described using Words of Estimative Probability (WEP), which are used by intelligence analysts in analytic reports to convey the likelihood of a future event occurring.
So, whether you’re called the VP of marketing, CMO, or chief growth officer (CGO), the challenge will be the same: Create successful digital marketing strategies when your global company or top brand is faced with unexpected opportunities or unanticipated threats in the unforeseeable future.
What are the odds that you can overcome that challenge?
You can increase the likelihood of success by reading case studies and then asking yourself two questions:
What do I notice?
What do I wonder?
I used this approach when I wrote the chapter on digital marketing strategy in the book, “Digital Marketing Fundamentals.” I shared two articles that I had written for Search Engine Journal:
Now, learning lessons from others is a good start, but you can significantly improve your chances of success by borrowing a big idea from my old friend and former colleague, Avinash Kaushik. He wrote an article titled, Stop Exceeding Expectations, Suck Less First.
He said that we should stop trying to “exceed the (often less-than-optimally informed) expectations of Wall Street Analysts” because “this desire to overachieve also comes at a very heavy cost – it drives sub-optimal behavior.”
Instead, he recommended this “as the #1 goal for your company: Suck less, every day.”
How does this incremental approach help a VP of marketing, CMO, or CGO achieve their business objectives?
“More often than not, magnificent success results from executing a business plan that is rooted in a strong understanding of the landscape of possibilities, and a deep self-awareness of business capabilities. These business plans will contain a structured approach…”
Then, he shared the Digital Marketing “Ladder of Awesomeness” below.
Image from Occam’s Razor by Kaushik, September 2024
Next, Kaushik shared the Digital Analytics “Ladder of Awesomeness” below, which outlines the KPIs for each step.
Image from Occam’s Razor by Kaushik, September 2024
Now, your twin ladders of awesomeness might look a little different than his because this is 2024 – not 2013.
And both digital marketing and digital analytics have evolved. But the step-by-step process that Kaushik outlined will help you make the hard choices that are the most relevant for your company or brand when it finds itself in an unexpected, unanticipated, or unforeseeable position.
So, the first step in this new era of SEO is developing digital marketing strategies that help you avoid the pitfalls, seize the opportunities, and climb the ladder of success.
In parallel, the second step should be learning how to measure incrementality, the conversions that would not have occurred without marketing influence.
Oh, it’s also smart to start climbing these twin ladders of awesomeness as quickly as you can.
Why? Because the clock is ticking.
According to Spencer Stuart’s most recent CMO Tenure Study, Fortune 500 CMOs had an average tenure of 4.2 years last year.
However, there are differences between diverse types of companies.
CMOs at B2B companies tend to stay in their roles for an average of 4.5 years; CMOs at B2C companies average 4.0 years; CMOs at the top 100 advertisers hand on to their jobs for just 3.1 years.
In the next couple of years, a significant percentage of CMO jobs are going to open suddenly. How likely is it that you’ll be ready to be interviewed for one of them?
Spencer Stuart also noticed that 34% of Fortune 500 CMOs lead functions in addition to marketing, such as communications. So, the “plus something extra” trend extends from the SEO manager level all the way up to the CMO level.
The Age Of Awesomeness
Take an expanded view of marketing leaders’ growing purview and start climbing the ladder as soon as humanly possible.
The only thing that’s left to do is coin a unique term for the new era we’re entering.
We could call it the “Age of Awesomeness” or the “Epoch of Twin Escalators.” But I’m open to other suggestions.
What have you noticed, and what have you wondered?
Google’s John Mueller answered a question on LinkedIn about how Google chooses canonicals, offering advice about what SEOs and publishers can do to encourage Google how to pick the right URL.
What Is A Canonical URL?
In the situation where multiple URLs (the addresses for multiple web pages) have the same content, Google will choose one URL that will be representative for all of the pages. The chosen page is referred to as the canonical URL.
Google Search Central has published documentation that explains how SEOs and publishes can communicate their preference of which URL to use. None of these methods force Google to choose the preferred URL, they mainly serve as a strong hint.
There are three ways to indicate the canonical URL:
Redirecting duplicate pages to the preferred URL (a strong signal)
Use the rel=canonical link attribute to specify the preferred URL (a strong signal)
List the preferred URL in the sitemap (a weak signal)
Some of Google’s canonicalization documentation incorrectly refers to the rel=canonical as a link element. The link tag, , is the element. The rel=canonical is an attribute of the link element. Google also calls rel=canonical an annotation, which might be an internal way Google refers to it but it’s not the proper way to refer to rel=canonical (it’s an HTML attribute of the link element).
There are two important things you need to know about HTML elements and attributes:
HTML elements are the building blocks for creating a web page.
An HTML attribute is something that adds more information about that building block (the HTML element).
The Mozilla Developer Network HTML documentation (an authoritative source for HTML specifications) notes that “link” is an HTML element and that “rel=” is an attribute of the link element.
Person Read The Manual But Still Has Questions
The person reading Google’s documentation which lists the above three ways to specify a canonical still had questions so he asked it on LinkedIn.
He referred to the documentation as “doc” in his question:
“The mentioned doc suggests several ways to specify a canonical URL.
1. Adding tag in
section of the page, and another, 2. Through sitemap, etc.
So, if we consider only point 2 of the above.
Which means the sitemap—Technically it contains all the canonical links of a website.
Then why in some cases, a couple of the URLs in the sitemap throws: “Duplicate without user-selected canonical.” ?”
As I pointed out above, Google’s documentation says that the sitemap is a weak signal.
Google Uses More Signals For Canonicalization
John Mueller’s answer reveals that Google uses more factors or signals than what is officially documented.
He explained:
“If Google’s systems can tell that pages are similar enough that one of them could be focused on, then we use the factors listed in that document (and more) to try to determine which one to focus on.”
Internal Linking Is A Canonical Factor
Mueller next explained that internal links can be used to give Google a strong signal of which URL is the preferred one.
This is how Mueller answered:
“If you have a strong preference, it’s best to make that preference very obvious, by making sure everything on your site expresses that preference – including the link-rel-canonical in the head, sitemaps, internal links, etc. “
He then followed up with:
“When it comes to search, which one of the pages Google’s systems focus on doesn’t matter so much, they’d all be shown similarly in search. The exact URL shown is mostly just a matter for the user (who might see it) and for the site-owner (who might want to monitor & track that URL).”
Takeaways
In my experience it’s not uncommon that a large website contains old internal links that point to the wrong URL. Sometimes it’s not old internal links that are the cause, it’s 301 redirects from an old page to another URL that is not the preferred canonical. That can also lead to Google choosing a URL that is not preferred by the publisher.
If Google is choosing the wrong URL then it may be useful to crawl the entire site (like with Screaming Frog) and then look at the internal linking patterns as well as redirects because it may very well be that forgotten internal links hidden deep within the website or chained redirects to the wrong URL are causing Google to choose the wrong URL.
Google’s documentation also notes that external links to the wrong page could influence which page Google chooses as the canonical, so that’s one more thing that needs to be checked for debugging why the wrong URL is being ranked.
The important takeaway here is that if the standard ways of specifying the canonical are not working then it’s possible that there is an external links, or unintentional internal linking, or a forgotten redirect that is causing Google to choose the wrong URL. Or, as John Mueller suggested, increasing the amount of internal links to the preferred URL may help Google to choose the preferred URL.
The concept of Compressibility as a quality signal is not widely known, but SEOs should be aware of it. Search engines can use web page compressibility to identify duplicate pages, doorway pages with similar content, and pages with repetitive keywords, making it useful knowledge for SEO.
Although the following research paper demonstrates a successful use of on-page features for detecting spam, the deliberate lack of transparency by search engines makes it difficult to say with certainty if search engines are applying this or similar techniques.
What Is Compressibility?
In computing, compressibility refers to how much a file (data) can be reduced in size while retaining essential information, typically to maximize storage space or to allow more data to be transmitted over the Internet.
TL/DR Of Compression
Compression replaces repeated words and phrases with shorter references, reducing the file size by significant margins. Search engines typically compress indexed web pages to maximize storage space, reduce bandwidth, and improve retrieval speed, among other reasons.
This is a simplified explanation of how compression works:
Identify Patterns: A compression algorithm scans the text to find repeated words, patterns and phrases
Shorter Codes Take Up Less Space: The codes and symbols use less storage space then the original words and phrases, which results in a smaller file size.
Shorter References Use Less Bits: The “code” that essentially symbolizes the replaced words and phrases uses less data than the originals.
A bonus effect of using compression is that it can also be used to identify duplicate pages, doorway pages with similar content, and pages with repetitive keywords.
Research Paper About Detecting Spam
This research paper is significant because it was authored by distinguished computer scientists known for breakthroughs in AI, distributed computing, information retrieval, and other fields.
Another of the co-authors is Dennis Fetterly, currently a software engineer at Google. He is listed as a co-inventor in a patent for a ranking algorithm that uses links, and is known for his research in distributed computing and information retrieval.
Those are just two of the distinguished researchers listed as co-authors of the 2006 Microsoft research paper about identifying spam through on-page content features. Among the several on-page content features the research paper analyzes is compressibility, which they discovered can be used as a classifier for indicating that a web page is spammy.
Detecting Spam Web Pages Through Content Analysis
Although the research paper was authored in 2006, its findings remain relevant to today.
Then, as now, people attempted to rank hundreds or thousands of location-based web pages that were essentially duplicate content aside from city, region, or state names. Then, as now, SEOs often created web pages for search engines by excessively repeating keywords within titles, meta descriptions, headings, internal anchor text, and within the content to improve rankings.
Section 4.6 of the research paper explains:
“Some search engines give higher weight to pages containing the query keywords several times. For example, for a given query term, a page that contains it ten times may be higher ranked than a page that contains it only once. To take advantage of such engines, some spam pages replicate their content several times in an attempt to rank higher.”
The research paper explains that search engines compress web pages and use the compressed version to reference the original web page. They note that excessive amounts of redundant words results in a higher level of compressibility. So they set about testing if there’s a correlation between a high level of compressibility and spam.
They write:
“Our approach in this section to locating redundant content within a page is to compress the page; to save space and disk time, search engines often compress web pages after indexing them, but before adding them to a page cache.
…We measure the redundancy of web pages by the compression ratio, the size of the uncompressed page divided by the size of the compressed page. We used GZIP …to compress pages, a fast and effective compression algorithm.”
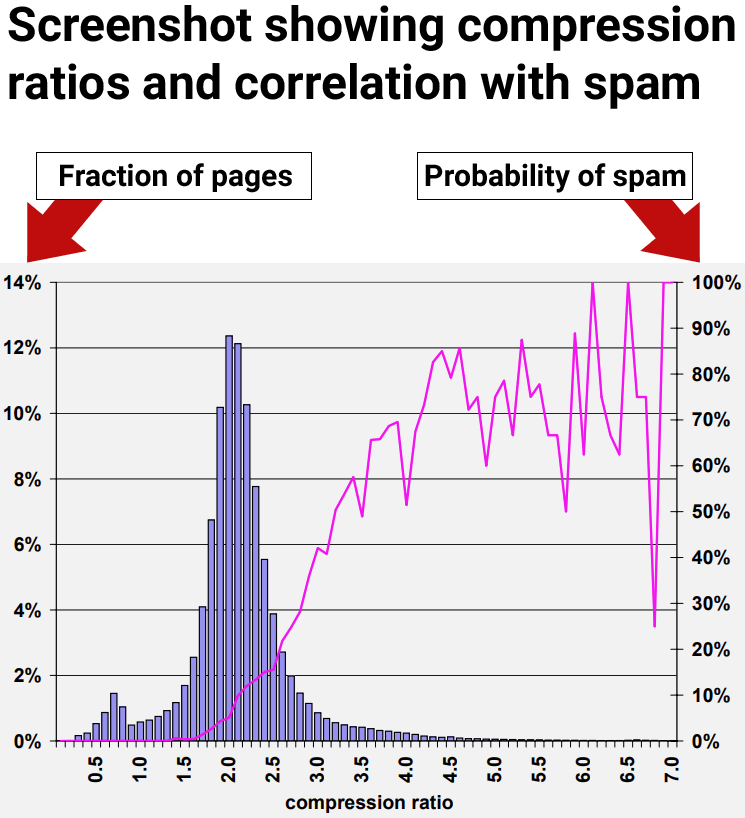
High Compressibility Correlates To Spam
The results of the research showed that web pages with at least a compression ratio of 4.0 tended to be low quality web pages, spam. However, the highest rates of compressibility became less consistent because there were fewer data points, making it harder to interpret.
Figure 9: Prevalence of spam relative to compressibility of page.
The researchers concluded:
“70% of all sampled pages with a compression ratio of at least 4.0 were judged to be spam.”
But they also discovered that using the compression ratio by itself still resulted in false positives, where non-spam pages were incorrectly identified as spam:
“The compression ratio heuristic described in Section 4.6 fared best, correctly identifying 660 (27.9%) of the spam pages in our collection, while misidentifying 2, 068 (12.0%) of all judged pages.
Using all of the aforementioned features, the classification accuracy after the ten-fold cross validation process is encouraging:
95.4% of our judged pages were classified correctly, while 4.6% were classified incorrectly.
More specifically, for the spam class 1, 940 out of the 2, 364 pages, were classified correctly. For the non-spam class, 14, 440 out of the 14,804 pages were classified correctly. Consequently, 788 pages were classified incorrectly.”
The next section describes an interesting discovery about how to increase the accuracy of using on-page signals for identifying spam.
Insight Into Quality Rankings
The research paper examined multiple on-page signals, including compressibility. They discovered that each individual signal (classifier) was able to find some spam but that relying on any one signal on its own resulted in flagging non-spam pages for spam, which are commonly referred to as false positive.
The researchers made an important discovery that everyone interested in SEO should know, which is that using multiple classifiers increased the accuracy of detecting spam and decreased the likelihood of false positives. Just as important, the compressibility signal only identifies one kind of spam but not the full range of spam.
The takeaway is that compressibility is a good way to identify one kind of spam but there are other kinds of spam that aren’t caught with this one signal. Other kinds of spam were not caught with the compressibility signal.
This is the part that every SEO and publisher should be aware of:
“In the previous section, we presented a number of heuristics for assaying spam web pages. That is, we measured several characteristics of web pages, and found ranges of those characteristics which correlated with a page being spam. Nevertheless, when used individually, no technique uncovers most of the spam in our data set without flagging many non-spam pages as spam.
For example, considering the compression ratio heuristic described in Section 4.6, one of our most promising methods, the average probability of spam for ratios of 4.2 and higher is 72%. But only about 1.5% of all pages fall in this range. This number is far below the 13.8% of spam pages that we identified in our data set.”
So, even though compressibility was one of the better signals for identifying spam, it still was unable to uncover the full range of spam within the dataset the researchers used to test the signals.
Combining Multiple Signals
The above results indicated that individual signals of low quality are less accurate. So they tested using multiple signals. What they discovered was that combining multiple on-page signals for detecting spam resulted in a better accuracy rate with less pages misclassified as spam.
The researchers explained that they tested the use of multiple signals:
“One way of combining our heuristic methods is to view the spam detection problem as a classification problem. In this case, we want to create a classification model (or classifier) which, given a web page, will use the page’s features jointly in order to (correctly, we hope) classify it in one of two classes: spam and non-spam.”
These are their conclusions about using multiple signals:
“We have studied various aspects of content-based spam on the web using a real-world data set from the MSNSearch crawler. We have presented a number of heuristic methods for detecting content based spam. Some of our spam detection methods are more effective than others, however when used in isolation our methods may not identify all of the spam pages. For this reason, we combined our spam-detection methods to create a highly accurate C4.5 classifier. Our classifier can correctly identify 86.2% of all spam pages, while flagging very few legitimate pages as spam.”
Key Insight:
Misidentifying “very few legitimate pages as spam” was a significant breakthrough. The important insight that everyone involved with SEO should take away from this is that one signal by itself can result in false positives. Using multiple signals increases the accuracy.
What this means is that SEO tests of isolated ranking or quality signals will not yield reliable results that can be trusted for making strategy or business decisions.
Takeaways
We don’t know for certain if compressibility is used at the search engines but it’s an easy to use signal that combined with others could be used to catch simple kinds of spam like thousands of city name doorway pages with similar content. Yet even if the search engines don’t use this signal, it does show how easy it is to catch that kind of search engine manipulation and that it’s something search engines are well able to handle today.
Here are the key points of this article to keep in mind:
Doorway pages with duplicate content is easy to catch because they compress at a higher ratio than normal web pages.
Groups of web pages with a compression ratio above 4.0 were predominantly spam.
Negative quality signals used by themselves to catch spam can lead to false positives.
In this particular test, they discovered that on-page negative quality signals only catch specific types of spam.
When used alone, the compressibility signal only catches redundancy-type spam, fails to detect other forms of spam, and leads to false positives.
Google Search Central published new documentation on Google Trends, explaining how to use it for search marketing. This guide serves as an easy to understand introduction for newcomers and a helpful refresher for experienced search marketers and publishers.
The new guide has six sections:
About Google Trends
Tutorial on monitoring trends
How to do keyword research with the tool
How to prioritize content with Trends data
How to use Google Trends for competitor research
How to use Google Trends for analyzing brand awareness and sentiment
The section about monitoring trends advises there are two kinds of rising trends, general and specific trends, which can be useful for developing content to publish on a site.
Using the Explore tool, you can leave the search box empty and view the current rising trends worldwide or use a drop down menu to focus on trends in a specific country. Users can further filter rising trends by time periods, categories and the type of search. The results show rising trends by topic and by keywords.
To search for specific trends users just need to enter the specific queries and then filter them by country, time, categories and type of search.
The section called Content Calendar describes how to use Google Trends to understand which content topics to prioritize.
Google explains:
“Google Trends can be helpful not only to get ideas on what to write, but also to prioritize when to publish it. To help you better prioritize which topics to focus on, try to find seasonal trends in the data. With that information, you can plan ahead to have high quality content available on your site a little before people are searching for it, so that when they do, your content is ready for them.”
Google Search Central updated their favicon documentation to recommend higher-resolution images, exceeding the previous minimum standard. Be aware of the changes described below, as they may impact how your site appears in search results.
Favicon
A favicon is a custom icon that is shown in browser tabs, browser bookmarks, browser favorites and sometimes in the search results. The word “favicon” is short for Favorites Icon.
An attractive favicon is useful for making it easier for users to find links to your site from their bookmarks, folders and browser tabs and can (in theory) help increase clicks from the search results. Thus, a high quality favicon that meets Google’s requirements is important in order to maximize popularity, user interactions and engagements, and visits from the search engine results pages (SERPs).
What Changed?
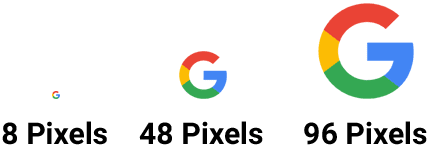
One of the changes to Google’s documentation is to make it clearer that a favicon must be in a square aspect ratio. The other important change is to strongly emphasize that publishers use a favicon that’s at least a 48×48 pixel size. Eight by eight pixels is still the minimum acceptable size for a favicon but publishers will probably miss out on the opportunity for a better presentation in the search results by going with a an 8×8 pixel favicon.
This is the part of the documentation that changed:
Previous version:
“Your favicon must be a multiple of 48px square, for example: 48x48px, 96x96px, 144x144px and so on (or SVG with a 1:1 (square) aspect ratio).”
New version:
“Your favicon must be a square (1:1 aspect ratio) that’s at least 8x8px. While the minimum size requirement is 8x8px, we recommend using a favicon that’s larger than 48x48px so that it looks good on various surfaces.”
Comparison Of Favicon Sizes
Reason For Documentation Changes
Google’s changelog for documentation says that the change was made to make it clearer what Google’s requirements are. This is an example of Google taking a look at their documentation to see how it can be improved. It’s the kind of thing that all publishers, even ecommerce merchants, should do at least once a year to identify if they overlooked an opportunity to be communicate a clearer message. Even ecommerce or local merchants can benefit from a yearly content review because things change or customer feedback can indicate a gap in necessary information.
This is Google’s official explanation for the change:
“Updated the favicon guidelines to state that favicons must have a 1:1 aspect ratio and be at least 8x8px in size, with a strong recommendation for using a higher resolution favicon of at least 48x48px.
What: Updated the favicon guidelines to state that favicons must have a 1:1 aspect ratio and be at least 8x8px in size, with a strong recommendation for using a higher resolution favicon of at least 48x48px.
Why: To reflect the actual requirements for favicons.”
When managing a website, choosing the right type of redirect is crucial for ensuring a smooth user experience and maintaining SEO performance.
While there are multiple ways to redirect a webpage, the two most common redirects are 301 (permanent) and 302 (temporary).
They both have distinct purposes, and selecting the wrong one can affect your site’s rankings and traffic.
In this guide, we’ll break down the differences between 301 and 302 redirects, provide practical examples of their usage, and explain how each impacts your SEO.
A/B testing, site maintenance, limited-time offers.
SEO Transfer Value
Transfers SEO value and rankings.
The original page retains SEO value.
Indexing In Google
The new URL gets indexed.
The original URL remains indexed.
Now, let’s cover some basics.
What Are HTTP Response Status Codes?
When you visit a website, your browser (like Chrome or Safari) asks the website’s server to send over the webpage so it can show it to you.
Search engines also request this information to index and rank the webpage.
The server responds with a message that lets the browser or search engine know if the request was successful or if there was a problem.
These messages are called HTTP Response Status Codes. They tell the browser whether to show the page, display an error, or take another action (like redirecting you to a different page).
For search engines, these codes help determine how the page should be indexed or whether it should be crawled, redirected, or removed from search results.
There are five main types of HTTP Response Status Codes:
Informational responses (1xx): This means the server received the request and is working on it, but the process isn’t done yet.
Successful responses (2xx): Everything went well. The server received the request, understood it, and provided the webpage as expected.
Redirection responses (3xx): The webpage has moved somewhere else, and the browser or search engine needs to go to a new location to get it (i.e., a redirect).
Client error responses (4xx): There’s a problem with the request from the browser, such as a page not being found (e.g., 404 Not Found).
Server error responses (5xx): The server couldn’t complete the request, usually because something went wrong on the server’s end.
What Are 301 And 302 Redirects?
301 and 302 redirects tell browsers and search engines that the webpage is no longer available at the requested URL.
They also say that the webpage has moved to a new URL and instruct the browser or search engine to automatically navigate to the new location.
Here are some reasons why you might need to redirect a webpage:
To specify the canonical (preferred) version of a URL (e.g., with or without “www”) so all visitors and search engines are directed to the same page.
To launch a new website or update a specific page and guide users to the correct content.
To force the browser to use the secure version of your site (HTTPS) when users try to access the non-secure version (HTTP).
To temporarily send users to a different page while the original one is being updated or fixed.
To redirect outdated content to a newer, more relevant page in order to keep your site up to date.
To fix broken or deleted pages by sending visitors to a functioning page instead.
Whether you should use a 301 or 302 redirect depends on what you’re trying to achieve.
Choosing the wrong type could negatively impact your SEO. While choosing the correct redirect ensures you maintain your current rankings.
What Is A 301 Redirect?
A 301 redirect tells browsers and search engines that a webpage has been moved permanently to a new URL.
It signals that the original URL should no longer be used, and all traffic should be sent to the new location.
This is because any links to the old URL will become broken links once the redirect has been removed. In other words, keeping the redirect active for a year or more ensures you don’t lose traffic if people still link to the old URL.
When Should You Use 301 Redirects?
A 301 redirect is most useful when you’re making permanent changes to your website structure or content.
Here are some common scenarios where a 301 redirect is the right choice:
Changing or moving the URL of a page: If you’re updating a page’s URL for better organization or readability – or if you’re moving it to a different location on your site – use a 301 redirect so that visitors and search engines can still find the page at its new address.
Fixing broken pages (404 errors): If a page has been deleted and is no longer available, use a 301 redirect to send visitors to a similar page (or your homepage) so they don’t get stuck on an error page.
Switching to a new domain: If you’re changing your domain name (for example, as part of a rebrand), use 301 redirects to send traffic from the old domain to your new one.
Cleaning up and combining pages: If you’re merging similar pages into one, use a 301 redirect to ensure that anyone visiting the old pages is automatically sent to the new, combined version.
Redirecting campaign landing pages: If you’ve created temporary landing pages for a promotion or campaign, you can use a 301 redirect to send visitors to a more permanent page after the campaign ends.
Redirecting extra domain names: If you’ve bought extra domain names (like common misspellings of your brand), use a 301 redirect to send visitors who use those domains to your main website.
Establishing a preferred domain: If you need to specify a preferred version of your website (e.g., “www.example.com” vs. “example.com”), a 301 redirect will ensure all visitors and search engines use the correct version.
Merging websites: If you combine two websites into one, use a 301 redirect to guide traffic from the old site to the new one.
What Is A 302 Redirect?
A 302 redirect tells browsers and search engines that a webpage has been moved temporarily to a new URL.
Unlike a 301 redirect, a 302 redirect indicates that the original URL will be used again in the future.
When Should You Use 302 Redirects?
A 302 redirect is useful when you need to send visitors to a different page for a short time, without making permanent changes to your website.
You should only use a 302 if you’re planning to bring the old page back eventually.
Here are some common use cases:
Testing or updating a page: If you’re working on a page and need to send visitors to another version temporarily, you can use a 302 redirect until the updates are done.
Running an A/B test: If you want to test two different versions of a page to see which one works better, you can use a 302 redirect alongside an A/B testing tool to send some visitors to a test version of the page, while the rest see the original version.
Temporarily promoting a different page: If you’re running a short-term promotion, you can use a 302 redirect to temporarily send users to a landing page for the promotion.
Maintenance or downtime: If you need to take a page offline for maintenance, you can use a 302 redirect to send users to a different page while and keep the original URL in place for when maintenance is complete.
Seasonal content: If you have content that’s only relevant at certain times of the year (like holiday sales), a 302 redirect can temporarily send visitors to the seasonal page.
How Do 301 And 302 Redirects Impact SEO?
Search engines treat 301 and 302 redirects differently – which is why it’s so important to choose the right one.
When you use a 301, Google transfers the authority, ranking power, and any backlinks associated with the old URL to the new location. This means the new URL inherits the SEO value that the original page built up over time.
Side note: With a 301 redirect, Google will eventually update its index (and, therefore, search results) to reflect the new URL. This usually happens fairly quickly.
When you use a 302 redirect, Google typically does not pass the ranking authority or backlinks from the old URL to the new one. And the original page continues to appear in the search results, since the change is only considered temporary.
Most problems only arise when people use a 301 or 302 redirect in the wrong context.
For example, using a 302 redirect when the change is actually permanent means Google won’t transfer the SEO value to the new URL. This could harm your new page’s ranking potential and limit your search visibility.
Likewise, if you use a 301 redirect for a change that’s only temporary, Google may treat the original page as permanently moved. This can cause it to lose rankings – even after you switch back to the original page.
“Setting up server side redirects requires access to the server configuration files (for example, the .htaccess file on Apache) or setting the redirect headers with server side scripts (for example, PHP).
You can create both permanent and temporary redirects on the server side.”
If you’re not sure how to do this, you can refer to resources like the Apache .htaccess Tutorial and a URL Rewriting Guide. These guides explain how to manage redirects through your server’s configuration files.
If your server doesn’t run on Apache, you’ll need to contact your host for specific instructions. Hosting platforms that use Nginx or Microsoft IIS will have different methods for setting up redirects.
For WordPress users, several plugins can simplify the process of creating redirects:
Redirection: This plugin allows you to easily manage 301 redirects, track 404 errors, and provides an easy-to-use interface for creating various types of redirects.
Simple 301 Redirects: This plugin focuses exclusively on 301 redirects and is perfect for creating simple, permanent redirects.
Redirects Impact Search Visibility
Understanding the differences between 301 and 302 redirects is crucial for maintaining your website’s SEO and ensuring a smooth user experience.
By choosing the right type of redirect for your needs, you can preserve your site’s ranking power and guide visitors to the correct pages efficiently.
Google CEO Sundar Pichai finally took action and made significant leadership changes.
Prabhakar Raghavan, who ran Google Search, Ads, Commerce, Geo, Assistant, and Payments, now reports to Pichai as Chief Technologist and hands the Search reins over to Nick Fox.
Pichai announced, “He’ll return to his computer science roots and take on the role of Chief Technologist,” which is Latin for “He messed up, so we’re giving him a role that saves face but has no direct impact on our core business.”
This move is a demotion for Raghavan, most likely as the result of a long series of fumbles across Search and AI.
Unless for personal reasons, who would voluntarily step away from Google’s most important position to “go back to their roots”? It doesn’t track.
The Raghavan era marks one of the hardest periods for Google, leaving behind five areas of struggle:
Monopoly
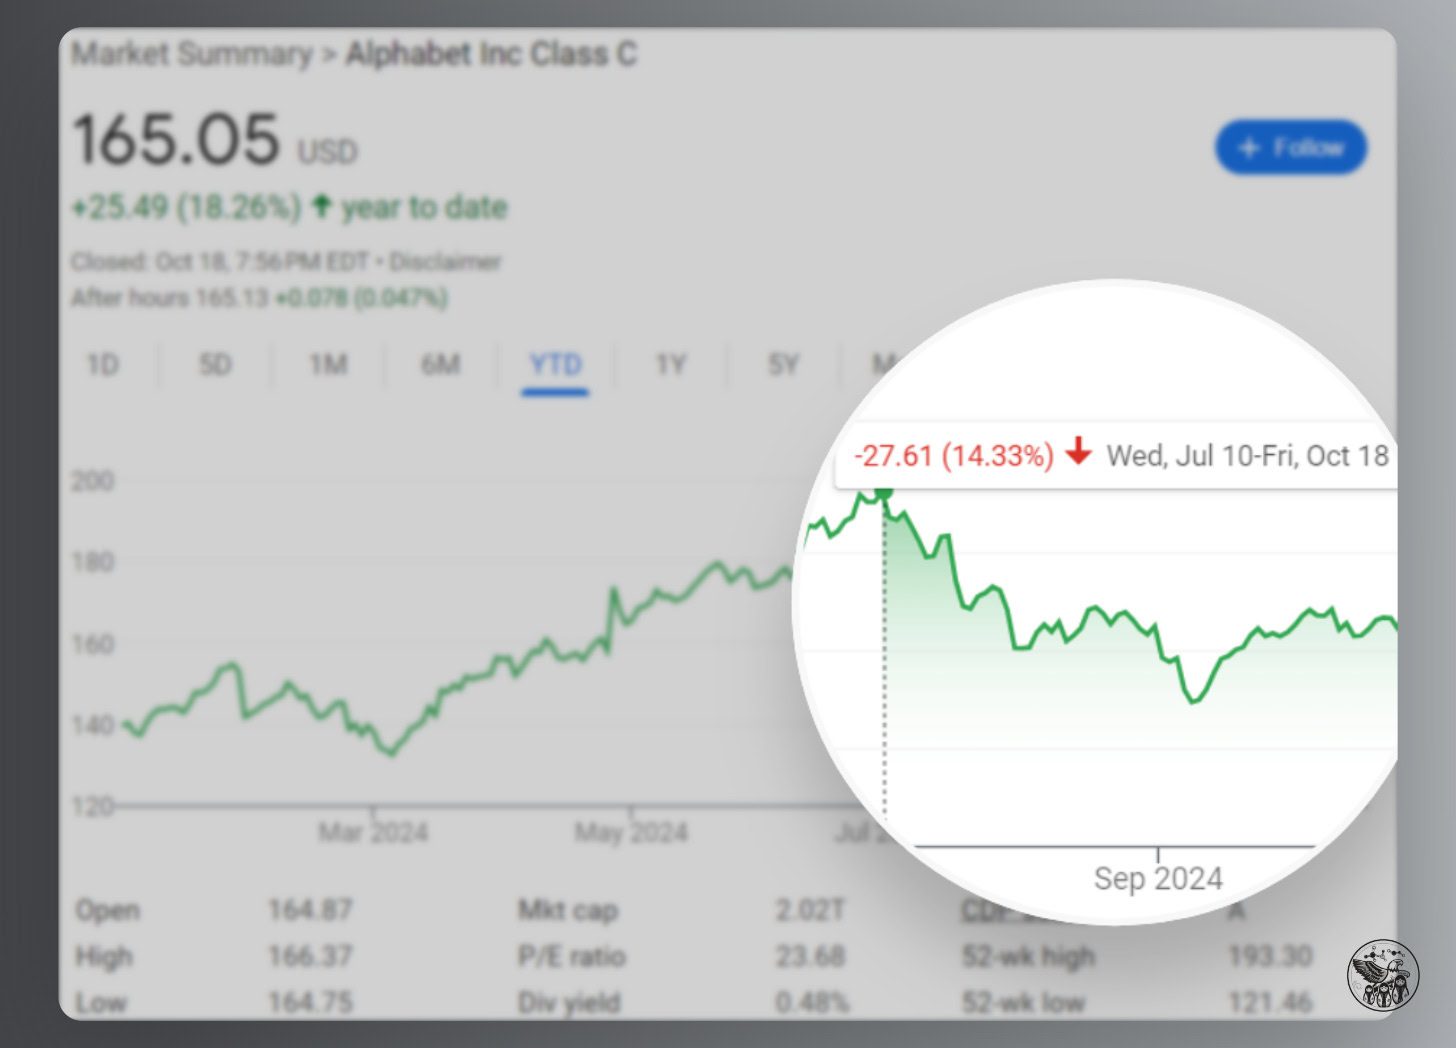
Google’s stock dropped 14% since its all-time high on July 10, in large part because the DOJ revealed that it would take aggressive action against Google.
Image Credit: Kevin Indig
After it was originally assumed that the DOJ sought to prevent Google from making exclusive deals with distributors like Apple, a new possible outcome floating around is to break Google up by detaching Chrome, the Play Store, and Android:
Behavioral and structural remedies that would prevent Google from using products such as Chrome, Play, and Android to advantage Google search and Google search-related products and features.
The DOJ even considers forcing Google to share rank data with competitors:
Barring Google from collecting sensitive user data, requiring it to make search results and indexes available to rivals, letting websites opt out of their content being used to train AI products and making Google report to a “court-appointed technical committee” are also on the table.
Realistically, the chances of these remedies actually coming into effect are low:
It will take years for the court and Google to go through several hoops of appeal.
There’s even a chance that a Trump presidency would veto aggressive remedies.
Precedents like the case against Microsoft show that the actual remedies are not as severe (Microsoft was ruled to split into two companies but found a settlement).
However, the reputation damage from exposed emails and statements during the lawsuits and bad press marks a turnaround from Google’s polished image.
And, there is a chance that the DOJ will follow through, which could weaken Google’s position in Search.
Search
Search has been heading in the wrong direction. Raghavan’s legacy is too many Reddit results, too many ads, unhelpful results, and cluttered SERPs.
Image Credit: Kevin Indig
In Free Content, I wrote about a study from Germany that showed how hard it is for Google to get spammy results out of search results.
Google’s Helpful Content Update sought to mitigate overoptimized search results but caused so much collateral damage that the industry revolted against Google until it released an update to the algorithm that specifically aimed to reestablish the search visibility for small and independent sites.
However, the effect was much smaller than expected, with many affected sites only regaining a fraction of their lost traffic.
An underlying problem with search results quality is the unclear direction or algorithm updates and untransparent and fuzzy guidance of “creating helpful content.”
In that same vein, it also became clear in 2024 that Google reacted to bad press and punished sites like Causal or Forbes, which were called out publicly for questionable practices.
Lars Lofgren uncovered a company within Forbes that also seems to create content on other sites and drives millions in revenue. Shortly after, Google seems to have taken at least some action against the site.
Google’s reactions show how important reputation is for the company.
Brand might be Google’s biggest moat, maybe even bigger than all the data it captures, as we can see at the fact of Google not losing market share in Europe after smartphone manufacturers were forced to show users choice screens for browsers and search engines.
However, most users still choose Google despite randomized choices for other search engines since the search engine market share distribution in the EU remains unchanged.
AI
Artificial intelligence terraforms the tech world. Despite Google having invented most parts of the engine, it’s not driving the car. OpenAI is.
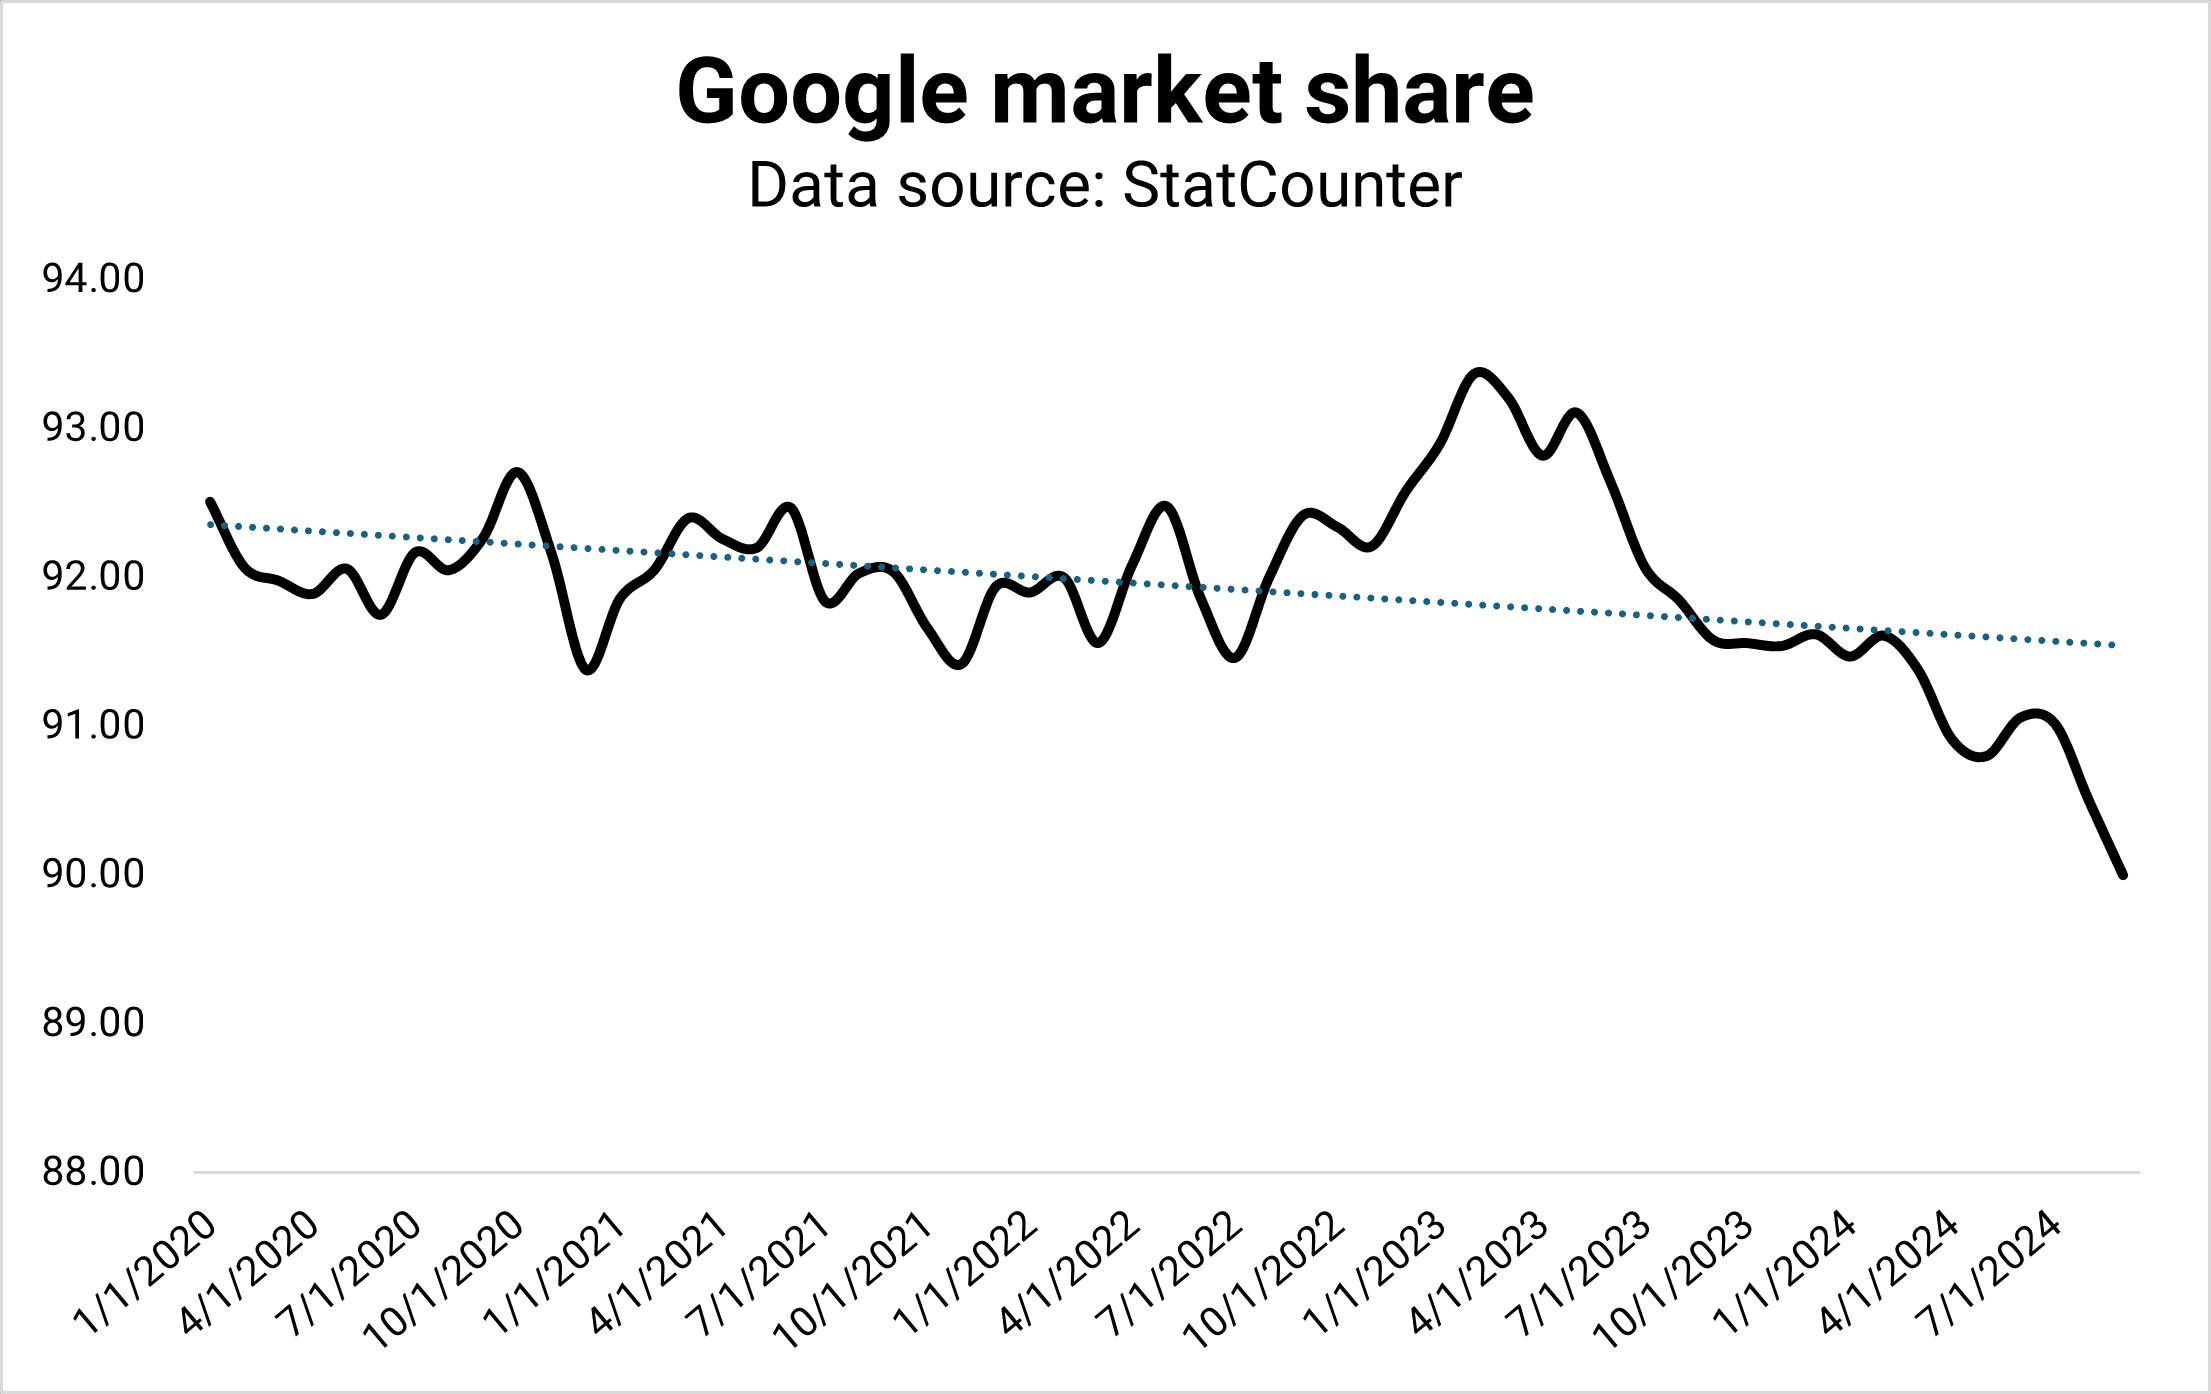
According to StatCounter, Google’s market share dropped to 90% for the first time since the drop to 88% in 2013. The drop could be the result of many reasons, and it could revert.
However, it could also mark a shift from Search to generative AI. I don’t see Google giving away market share to Bing or DuckDuckGo but ChatGPT, Perplexity, and Microsoft Copilot.
Image Credit: Kevin Indig
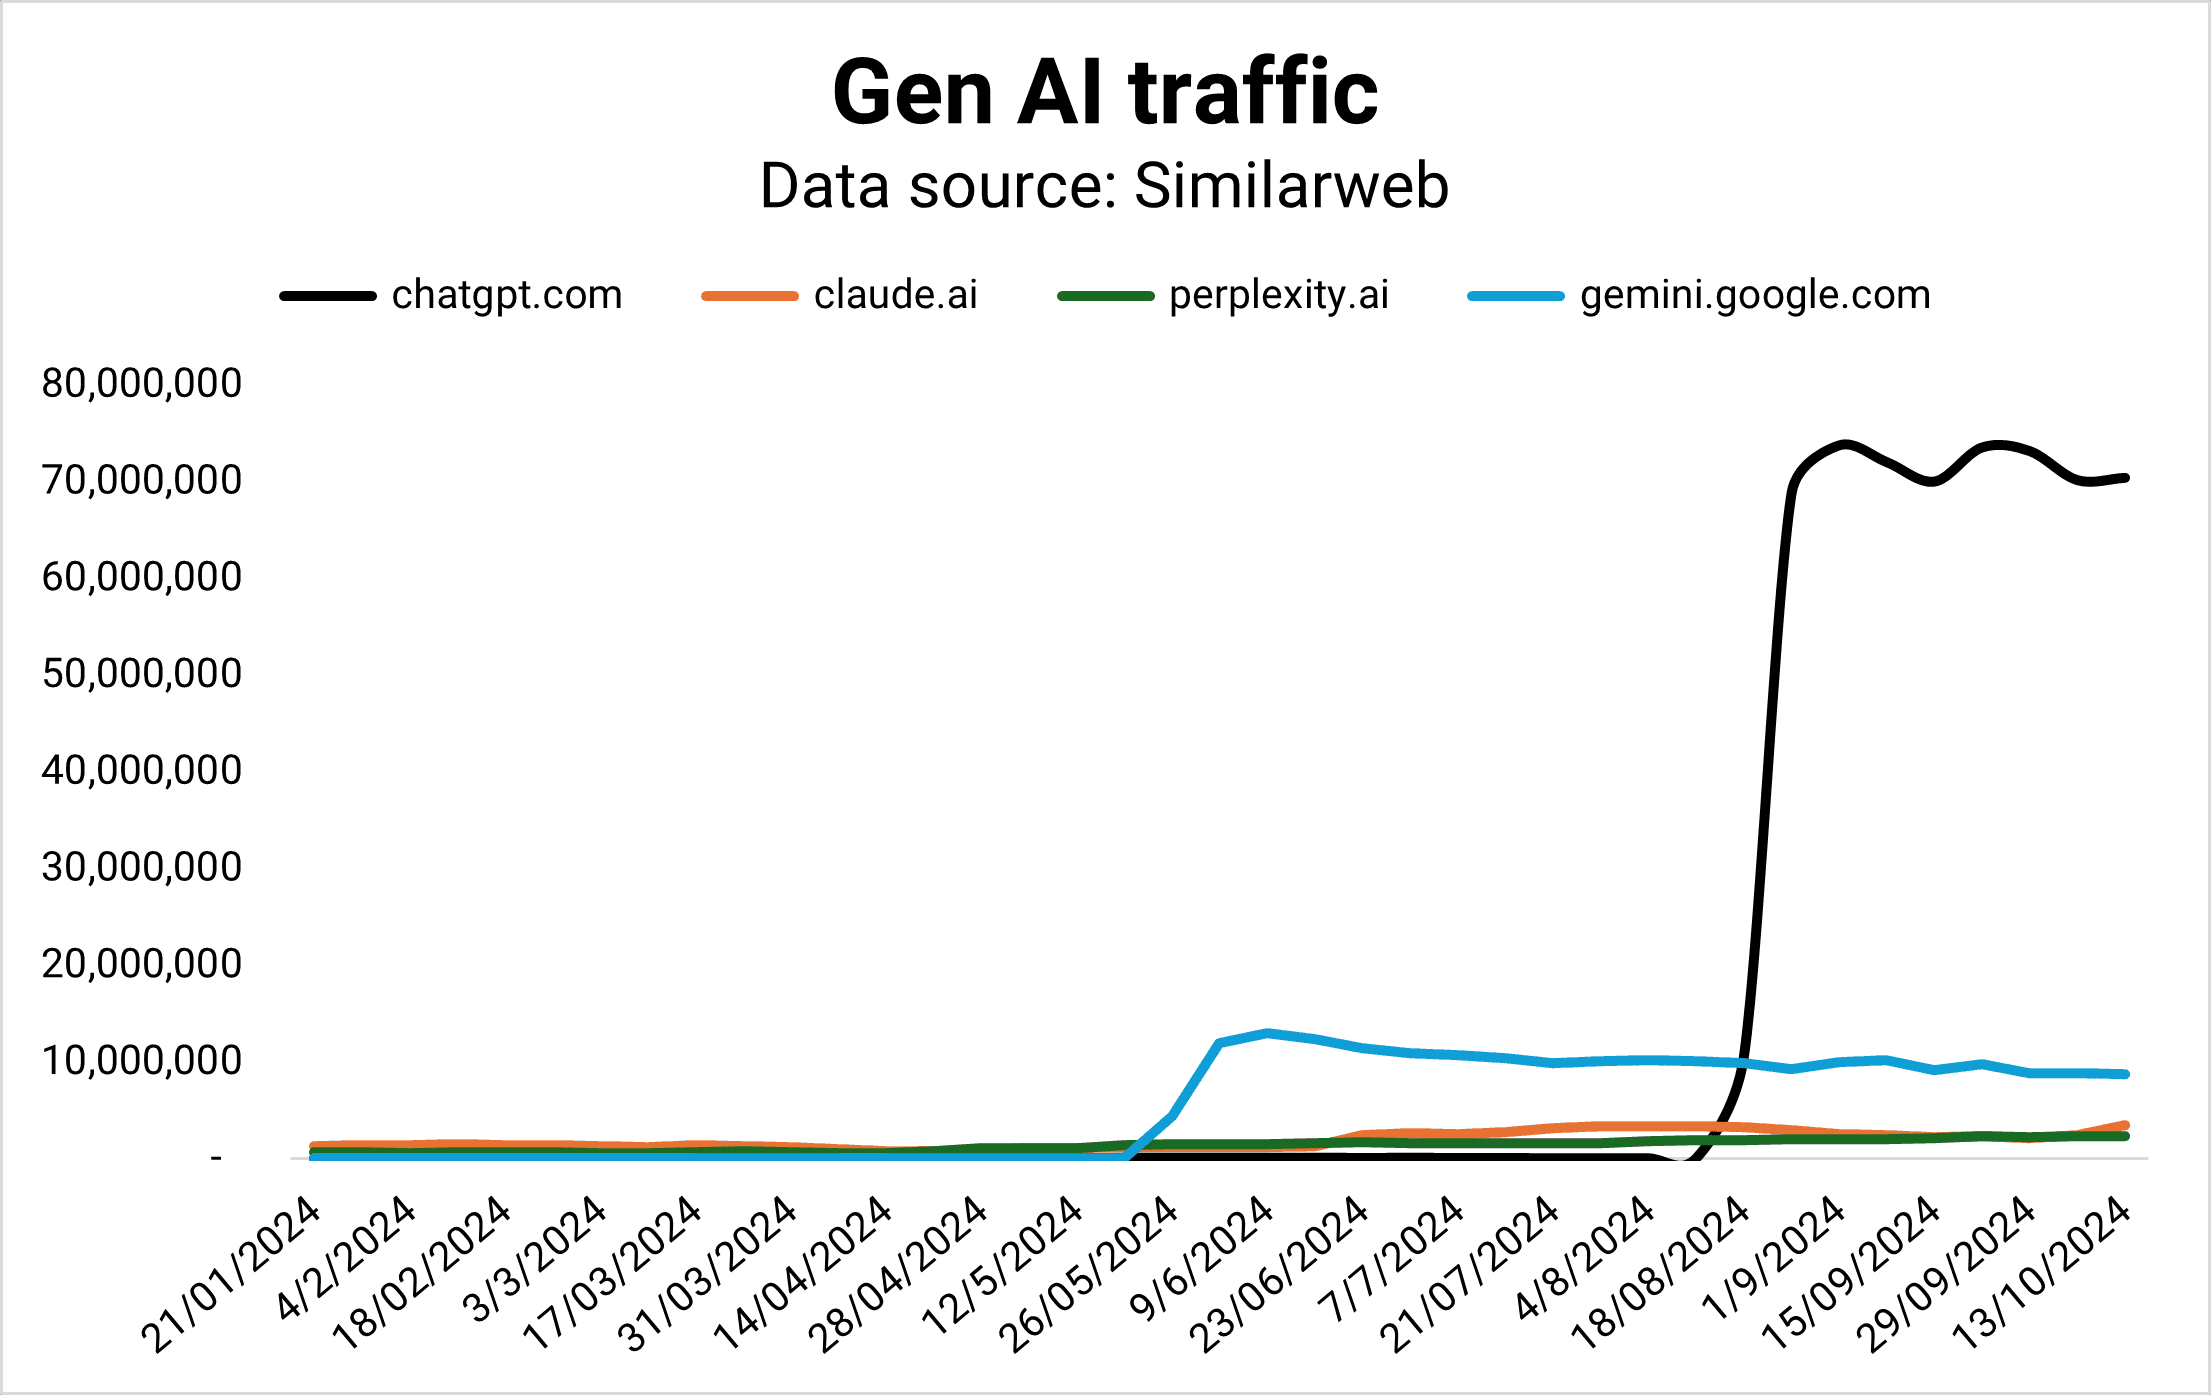
While Google maintains a 90% market share in Search, it doesn’t lead in the market of the future: Gen AI.
Gemini was supposed to be Google’s horse in the AI race, but its market share is flattening while Claude and Perplexity are gaining ground – fast.
OpenAI is currently winning the Gen AI competition by traffic (Image Credit: Kevin Indig)
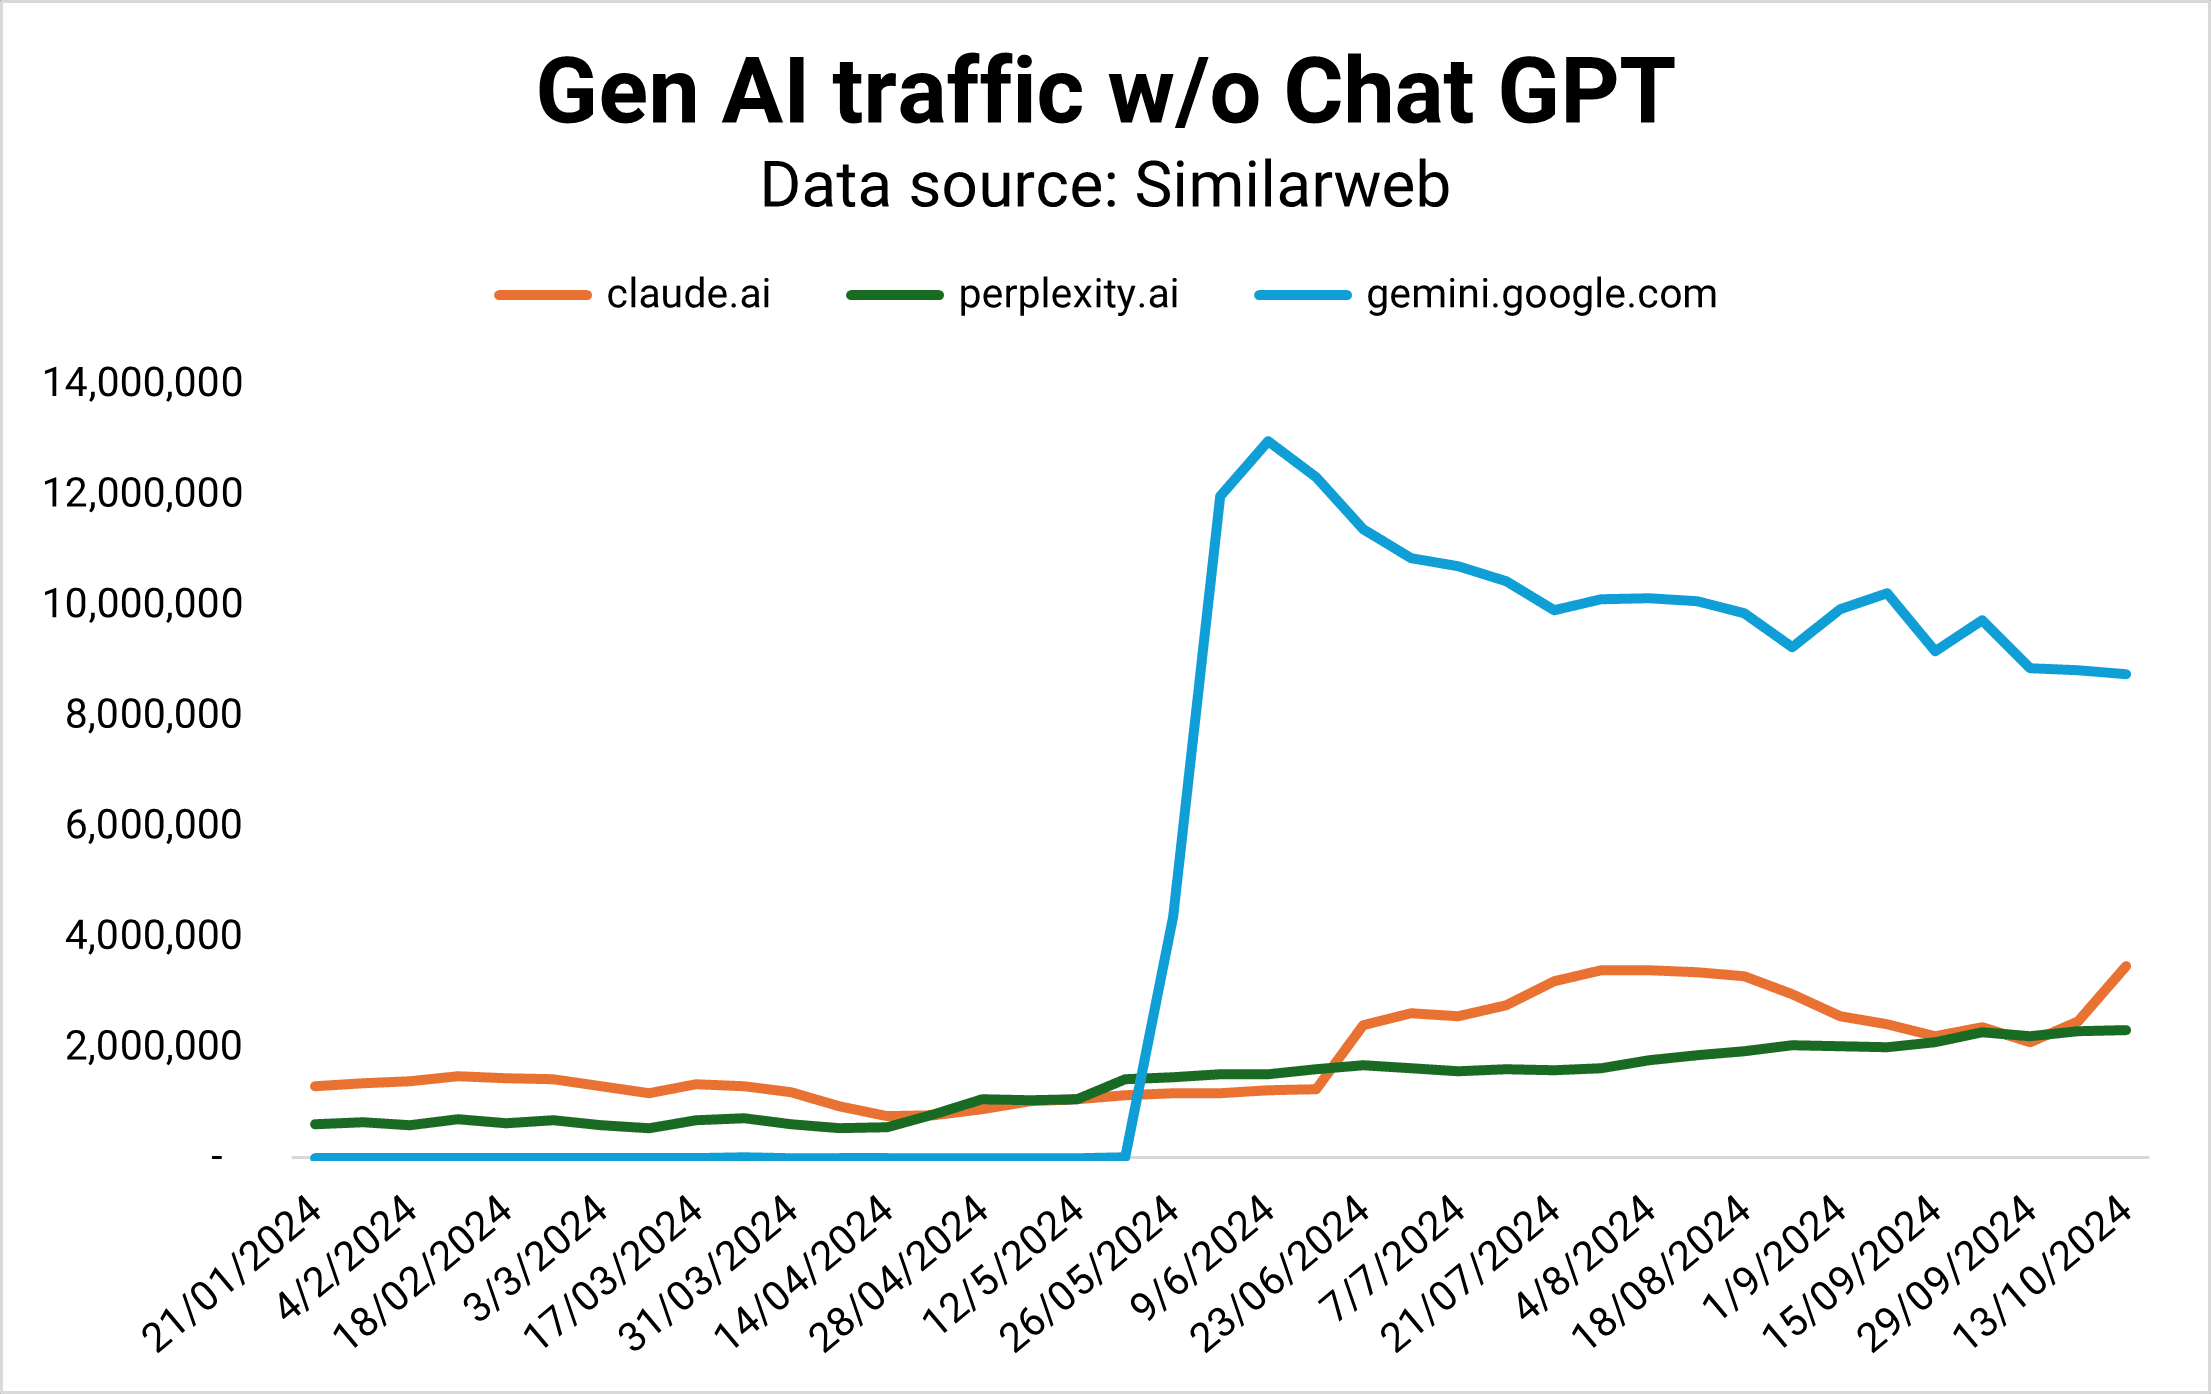
Taking Chat GPT out of the picture, we can see that Gemini is stagnating (Image Credit: Kevin Indig)
In 2024, Perplexity answered as many queries per month as it did in the whole year of 2023. The number is still small compared to Google, but the trend is growing.
A series of painful fumbles – from diverse Nazi pictures to fake demo videos and misinformation – mark Google’s chase to keep up with the competition.
Then there are fumbled AI product launches. Google’s first reaction to ChatGPT’s stunning success was a stunning failure. The introduction of Bard in February 2023 cost Alphabet $100 billion in market value due to false facts in the announcement.
In December 2023, an impressive demo of Gemini turned into a PR disaster when it turned out to be fake.
In March 2024, Alphabet’s shares dropped by -5% when it turned out Gemini delivered heavily biased and obscure historical images.
Google wants to get AI right so badly that it’s willing to cut corners. Not something you’d expect from the company that invented the underlying LLM technology (Transformers) in the first place.
Former CEO Eric Schmidt’s opinion about the cause of Google’s struggles didn’t help the situation:
“Google decided that work life balance and going home early and working from home was more important than winning. And the reason startups work is because the people work like hell.”
Google’s AI Overviews are the antithesis of the classic search model. Early referral traffic data from gen AI like ChatGPT, Gemini, and Perplexity shows a tiny amount of users clicking through to sites.
If that’s any indication of what we can expect from AI Overviews, Google is turning from a click distributor to an engagement platform.
Advertising
The big question for Google shareholders is how well the company can navigate advertising in the new LLM search world.
Ads can be complementary to search results. But, when users get the answer directly, sponsored results distract from the experience. The old ad format might not fit the new mold. Google has to figure this out but has not yet delivered an innovative approach.
AI transforms digital advertising across creative + copy, matching/targeting, and spend optimization.
However, with more AI Overviews answering questions in the search results, users might need fewer queries to solve problems overall, shrinking the ad market for Google.
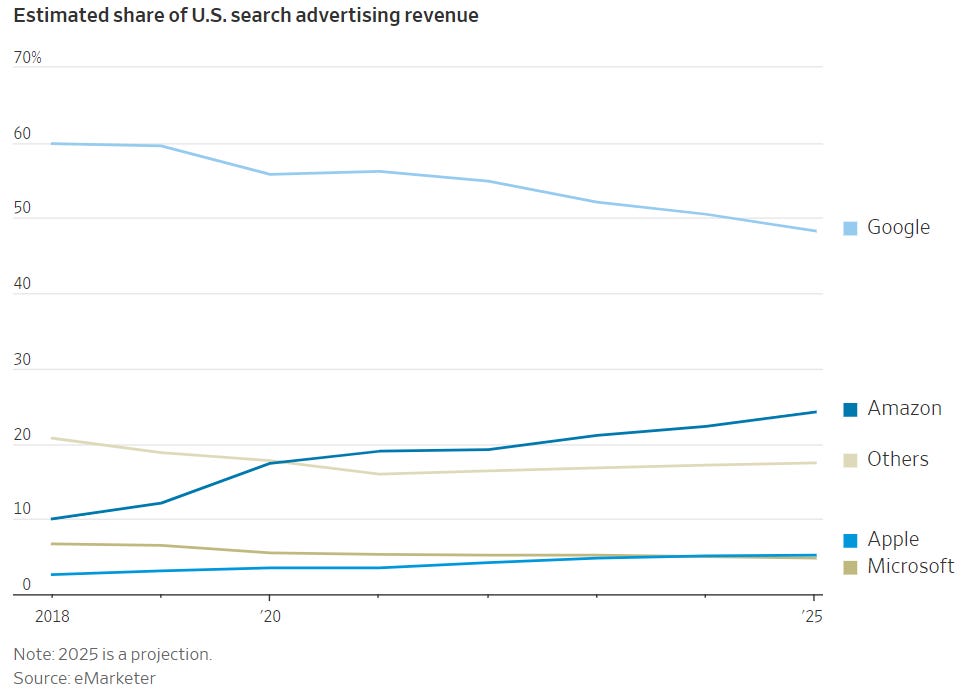
Google is projected to hit an all-time low of less than 50% of available ad dollars next year. Strong challengers like Amazon and TikTok and long-term rivals like Meta are grabbing market share.
Google is projected to hit less than 50% ad revenue market share in 2025 (source) (Image Credit: Kevin Indig)
Google announced a new shopping experience with little to do with a classic search engine.
The reimagined ecommerce experience shows how hard Google wants to compete with Amazon, which faces more competition from TikTok.
As a result, TikTok is competing not only with Google in search but also with ecommerce.
The focus on ecommerce indicates the opportunity for Google to make money from high-intent searches when users don’t need to click through to sites anymore for answers.
But Google wasn’t able to ever kick Amazon off the throne, leaving it exposed for commercial queries.
We can only hope that Prabhakar’s departure leads to a better Google Search. Nick Fox, who will succeed Raghavan, might not be the change agent we seek.
In an email thread with then Head of Search Ben Gomes from 2019, Fox seems open to taking on revenue goals but also not an advocate for it.
To Ben Gomes’ concern:
“…I think we are getting too involved with ads for the good of the product and company…”
Fox responds:
“Given that (a) we’re responsible for Search, (b) Search is the revenue engine of the company, and (c) revenue is weak, it seems like this is our new reality of our jobs?”
However, I question how important Fox is for the future of search anyway. The more important person is Demis Hassabis, founder and CEO of Deep Mind.
Every leadership change brings with it an opportunity to move to a better formation.
With Raghavan’s “promotion” come two important shifts: Gemini moving under Deep Mind, and Assistant moving to the devices team.
Hassabis is the person we need to watch because he now runs Gemini and with it, the quality and volume of AIO answers.
On the talking track, Hassabis stresses the need for responsible use of AI.
Marketers work with search data every day, but we’re greatly underutilizing its potential.
Let me explain.
Search data can tell us all kinds of things about markets, audiences, behavior, and preferences. It’s a source of intelligence that informs smarter, better, more timely business decisions beyond SEO.
In this article, I’ll introduce you to a different way of looking at “search data.”
We’ll talk about sources, which data to pull, and how to use it to arrive at powerful insights quickly.
What Is Search Data?
Search data is any data collected when a user searches a public website by entering a query string to find relevant information (products, information, or answers) from a library of different content (website pages, media) published from different sources (websites, creators).
When people conduct this type of search, they take direct action driven by a need. Put more simply, search data is “active demand.”
Looking at search behavior at scale unlocks a new way of gauging demand for whole industries, specific verticals, unique topics, individual brands, and beyond. This process is known as digital market intelligence.
What Is Digital Market Intelligence?
Digital market intelligence collects and analyzes thousands to (sometimes) millions of digital data points – from public, ethically sourced data – to get to the kind of insights that would traditionally require qualitative surveying.
Except that it’s a lot faster than surveying, and often, it’s more accurate because:
The data reflects real behavior from real people who are free from survey bias or influence.
It collects vast data sets in mere days (versus weeks or even months), ensuring timeliness and relevance.
Data sets contain significantly more data representing huge swaths of the population (versus a small survey sample).
Image from Gray Dot Co, October 2024
Search data is one of the primary inputs in digital market intelligence because it provides an abundance of real user behavior data at an extremely low cost.
Note: DMI is most effective when looking at established industries with a meaningful digital footprint – it doesn’t work for everything!
Where Do We Get The Data?
When most of us think of “search data,” we think of Google data. And make no mistake, that’s a huge piece of the puzzle. Google is still a giant in the search game!
But we’re also stepping out of the silo and acknowledging that sources like YouTube, Pinterest, TikTok, etc. are sources where users exhibit active demand.
The datasets from each are extremely valuable for digital market intelligence because we can tap into them at a marginal cost via APIs, platform-specific reporting tools, and third-party tools.
(For a lot cheaper than traditional consumer insights work!)
Google Search Console.
Google Ads.
Youtube API.
Google Trends.
Third-party tools like Semrush or Ahrefs.
Pinterest.
TikTok.
Image from Gray Dot Co, October 2024
Which Search Data Is Meaningful?
Now that we’ve established where we’re actually sourcing the data, what are we pulling?
Metrics we work with day in and day out are the raw inputs for calculations that answer big business questions:
Image from Gray Dot Co, October 2024
Keyword volume quantifies how often people actively look for products, information, or brands at any given time.
Hashtag volume measures how much of the content landscape is saturated by a given topic or brand.
Keyword intent identifies where people are in the customer journey, plus common behavior and language at different funnel stages.
Competitor research compares demand for brands apples-to-apples, plus how much demand each captures in the landscape.
Historical trends create a clear snapshot of shifts in demand to illustrate the trendline for any topic area over time.
What Can Search Data Tell Us About The Market?
Digital market intelligence can answer a lot of the questions marketing teams and even business leaders run into regularly.
Let’s take a look at some of the most common and illustrate how DMI can yield quick insights using search data.
Did The Market Grow Or Shrink YoY?
This is basically an exercise in summing active demand for the search terms that apply to your business or industry.
In a classic consumer insights sense, the size of the market is generally referred to as the Total Addressable Market.
To quantify TAM using search data, calculate the total keyword volume for the year across relevant search terms. You can source and export keyword volume at scale by using a third-party tool such as Semrush or Ahrefs.
Once you have your TAM total for both years, compare them to quantify the YoY difference. In terms of a calculation, it would look something like this:
[Total volume: Relevant keywords in year A] - [Total volume: Relevant keywords in year B] = YoY change in market size
Is An External Factor Having An Impact?
Your business tactics could drive a jump or drop in performance, but it could be something that’s out of your control altogether.
Leadership will want to know whether it’s the “tide” or something the “boat” (your marketing team) is doing.
Sometimes, the quickest and easiest way to tell is to turn to search data — specifically our often-overlooked friend, Google Trends.
For the sake of example, let’s take a look at a simple case of an external factor driving increased demand for a service. Specifically, did the Olympics drive an increase in the demand for gymnastics lessons?
We know that the Olympics took place between Jul. 26 and Aug. 11, 2024. Now, we need to know how searches for “gymnastics lessons” in this window compare to other periods of time outside of the Olympics.
Screenshot from Google Trends, September 2024
It’s clear from the data that there was a significant increase in interest in gymnastics lessons during the Olympic window.
We see a much smaller increase during the window of the 2020 Olympics (Jul. 23 – Aug. 8, 2021), but we can probably attribute this to COVID-19 and related restrictions/behaviors.
This type of insight isn’t just valuable for gauging whether the industry tide affected performance.
It’s also invaluable for determining when to lean into specific products, information, or trends through levers such as increasing paid spend, launching social campaigns, or shifting the overall marketing mix to meet the moment.
How Does Demand For Our Brand Compare?
Search data allows us to compare active demand for Brand A to active demand for Brand B to answer this age-old question.
For this exercise, pull keyword volumes for any queries that contain Brand A’s name in the string. Then, do the same for Brand B over the same window of time.
Add the keyword volume for each respective brand to come up with the brand total. Then, calculate the difference to understand how they stack up.
[Total volume: Brand A branded KWs over X months] - [Total volume: Brand B branded KWs over X months] = Difference in active brand demand
Are We Visible Enough To Drive Awareness?
The search landscape is one big conversation. “Share of voice” can tell you how much of the conversation the brand is actually participating in.
This measurement takes the total keyword volume a brand is competing for as a percentage of the total volume of possible, relevant keyword opportunities for the brand.
Since only 0.44% of users visit the second page of search results, start by identifying keywords where a brand ranks on page one (either traditional placement, featured snippet, or AI Overviews). Because if it’s not on page one, a brand isn’t actually competing in most cases.
Calculate the aggregate volume for these keywords, divide it by the total volume across all relevant keyword opportunities (regardless of ranking), and multiply by 100.
( Brand-eligible keyword volume] / [Landscape keyword volume] ) x 100 = [% Share of Voice]
It Starts With A Simple Shift In Perspective
Looking at familiar numbers in new ways starts to unlock business-critical narratives.
And it doesn’t stop with search data!
Data from social media platforms and forum sites hold their own unique opportunities to understand markets even more through the lenses of engagement and consumer behavior.
Step one is making the mental shift from search data to demand data.
It’s a subtle shift that can take us out of our siloed way of looking at data. Breaking down those walls is the key to making digital market intelligence work for you.
Go forth and find those illuminating answers — at the speed of modern business.


![Google search for [is google going downhill]](https://ecommerceedu.com/wp-content/uploads/2024/10/google-search-99.jpg)