SerpApi filed a motion to dismiss Google’s federal lawsuit, two months after Google sued the company under the DMCA for allegedly bypassing its SearchGuard anti-scraping system.
The filing goes beyond disputing the technical allegations. SerpApi is challenging whether Google has the legal right to bring the case at all.
The Standing Question
SerpApi’s core argument is that the DMCA protects copyright owners, not companies that display others’ content.
Google’s complaint cited licensed images in Knowledge Panels, merchant-supplied photos in Shopping results, and third-party content in Maps as examples of copyrighted material SerpApi allegedly scraped.
SerpApi CEO Julien Khaleghy wrote that the content in Google’s search results belongs to publishers, authors, and creators, not to Google.
Khaleghy writes:
“Google is a website operator. It is not the copyright holder of the information it surfaces.”
Khaleghy argued that only a copyright holder can authorize access controls under the DMCA. Google, he wrote, is trying to assert those rights without the knowledge or consent of the creators whose work is at issue.
In the 31-page motion, SerpApi invokes the Supreme Court’s 2014 ruling in Lexmark International, Inc. v. Static Control Components, Inc., which established that a plaintiff must show injuries within the “zone of interests” the law was designed to protect. SerpApi argues Google’s alleged injuries, including infrastructure costs and lost ad revenue from automated queries, don’t fall within what the DMCA was built to address.
The Circumvention Question
SerpApi also disputes whether bypassing SearchGuard counts as circumvention under the DMCA.
Google alleged in December that SerpApi solved JavaScript challenges, used rotating IP addresses, and mimicked human browser behavior to get past SearchGuard.
Khaleghy wrote that the DMCA defines “to circumvent a technological measure,” in part, as “to descramble a scrambled work, to decrypt an encrypted work, or otherwise to avoid, bypass, remove, deactivate, or impair a technological measure,” and argued SerpApi does none of those things.
Khaleghy writes:
“We access publicly visible web pages, the same ones accessible to any browser. We do not break encryption. We do not disable authentication systems.”
The motion states Google “does not allege unscrambling or decryption of any work, or the impairment, deactivation, or removal of any access system.” SerpApi calls SearchGuard a bot-management tool, not a copyright access control.
Why This Matters
The outcome could reach beyond SerpApi. Google’s DMCA theory, if accepted, would let any platform displaying licensed third-party content use the statute to block automated access to publicly visible pages.
When we covered Google’s original filing in December, I noted the central question was whether SearchGuard qualifies as a DMCA-protected access control. SerpApi’s motion now adds a layer underneath that. Even if SearchGuard qualifies, SerpApi argues Google isn’t the right party to enforce it.
In a separate case decided on December 15, 2025, U.S. District Judge Sidney Stein dismissed Ziff Davis’s DMCA Section 1201(a) anti-circumvention claim tied to robots.txt against OpenAI, holding Ziff Davis failed to plausibly allege that robots.txt is a technological measure that effectively controls access, or that OpenAI circumvented it.
Google’s SearchGuard is more technically complex than a robots.txt directive, but both cases test whether the DMCA can be used to restrict automated access to publicly available content.
Looking Ahead
The hearing on SerpApi’s motion is scheduled for May 19, 2026. Google will file its opposition before then.
SerpApi also filed a motion to dismiss in a separate lawsuit brought by Reddit in October, which named SerpApi alongside Perplexity, Oxylabs, and AWMProxy. Both cases raise questions about using DMCA anti-circumvention claims to challenge bot evasion and automated access to pages that are viewable in a normal browser.
Microsoft introduced an AI Performance dashboard in Bing Webmaster Tools, giving visibility into how content gets cited across Copilot and AI-generated answers in Bing.
The feature, now in public preview, shows citation counts, page-level activity, and trends over time. It covers AI experiences across Copilot, AI summaries in Bing, and select partner integrations.
The AI Performance dashboard provides four core metrics.
Total citations tracks how often your content appears as a source in AI-generated answers during a selected time period. Average cited pages shows the daily average of unique URLs from your site referenced across AI answers.
Page-level citation activity breaks down which specific URLs get cited most often. This lets you see which pages AI systems reference and how that activity changes over time.
The dashboard also introduces “grounding queries,” which Microsoft describes as the key phrases AI used when retrieving content for answers. The company notes this data represents a sample rather than complete citation activity.
A timeline view shows how citation patterns change over time across supported AI experiences.
Why This Matters
This is the first time Bing Webmaster Tools has shown how often content is cited in generative answers, including which URLs are referenced and how citation activity changes over time.
Google includes AI Overviews and AI Mode in Search Console’s overall Performance reporting, but it doesn’t offer a dedicated AI Overviews/AI Mode report or citation-style URL counts. AI Overviews also occupy a single position, with all links assigned that same position.
Bing’s dashboard goes further. It tracks which pages get cited, how often, and what phrases triggered the citation. That gives you data to work with instead of guesses.
Looking Ahead
AI Performance is available now in Bing Webmaster Tools as a public preview. Microsoft said it will continue refining metrics as more data is processed.
Landing pages are a core part of the user journey, influencing ad performance, conversion rates, and how effectively you can test, personalize, and scale your marketing.
Lead generation isn’t just about driving traffic; it’s about delivering seamless, trustworthy landing page experiences that convince visitors to take the next step. Even the best ad campaigns can fall flat if your landing pages aren’t designed to convert.
In this article, we will compare the top platforms that help marketers create fast, compelling, conversion-focused pages and then walk you through how to choose a landing page builder that fits your goals,
While this is, by no means, an exhaustive list of considerations, it’s a starting point to help you choose a landing page builder that makes sense for your business needs.
Now, let’s look at seven of the best landing page builders to choose from.
Pure Landing Page Builders
1. Unbounce
Screenshot from Unbounce.com, December 2025
Unbounce is a leading landing page builder renowned for its focus on conversion rate optimization (CRO). Its website promises to help you “launch landing pages faster, accelerate results” with a no-code approach augmented by AI-powered tools.
It offers a suite of advanced tools, such as A/B testing, dynamic text replacement, custom code, and the Smart Traffic (AI optimization) system, which optimizes visitor flow to the highest-converting page variant based on user behavior and characteristics.
It also focuses on features that can help you boost your lead gen efforts, such as opt-in email pop-ups and sticky banners.
With its customizable conversion-optimized responsive templates and drag-and-drop builder, Unbounce makes it easy to create landing pages that are both engaging and effective.
Compared to some other options on this list, Unbounce is a particularly robust platform with tons of customization and integrations, and the price point reflects that.
As a premium offering with a steeper learning curve, it might not be the best for beginners, but its AI-powered features and conversion-focused tools make it a formidable tool for achieving your goals.
Pros:
Advanced A/B testing and AI-driven optimization.
Large selection of responsive templates.
Integrated features for enhancing lead capture.
Cons:
Higher price point than some other builders, which might not work for those with limited budgets.
Complex setup and steeper learning curve for new users.
Some customization limitations, such as not being able to mix and match page template sections.
Pricing
The Build plan starts at $99/month (billed monthly) and covers unlimited conversions, one root domain, and up to 20,000 monthly unique visitors.
Other paid plans range from $149/month (billed monthly) to $249/month (billed monthly), with a custom price available for their Agency plan. There are cheaper options for annual billing.
What Users Say
Unbounce is known for ease of use and quality. GhostProsaic praised the tool, saying “unless you’re coding the entire page from scratch, and hosting it yourself, the upsides of using something like Unbounce outweigh the downsides of having to do a custom build.”
In response to a r/PPC poster asking if they use Unbounce, user PaidSearchHub says, “We use Unbounce and it also has a native integration with our lead intelligence platform. Sometimes, ya get what ya pay for.”
But it seems the pricing is higher-end vs. the rest. Others like QuantumWolf99 declared that, “Most agencies have moved away from Unbounce/Instapage because the pricing doesn’t justify the performance difference anymore. WordPress with Elementor or custom Webflow builds usually convert just as well at a fraction of the cost.”
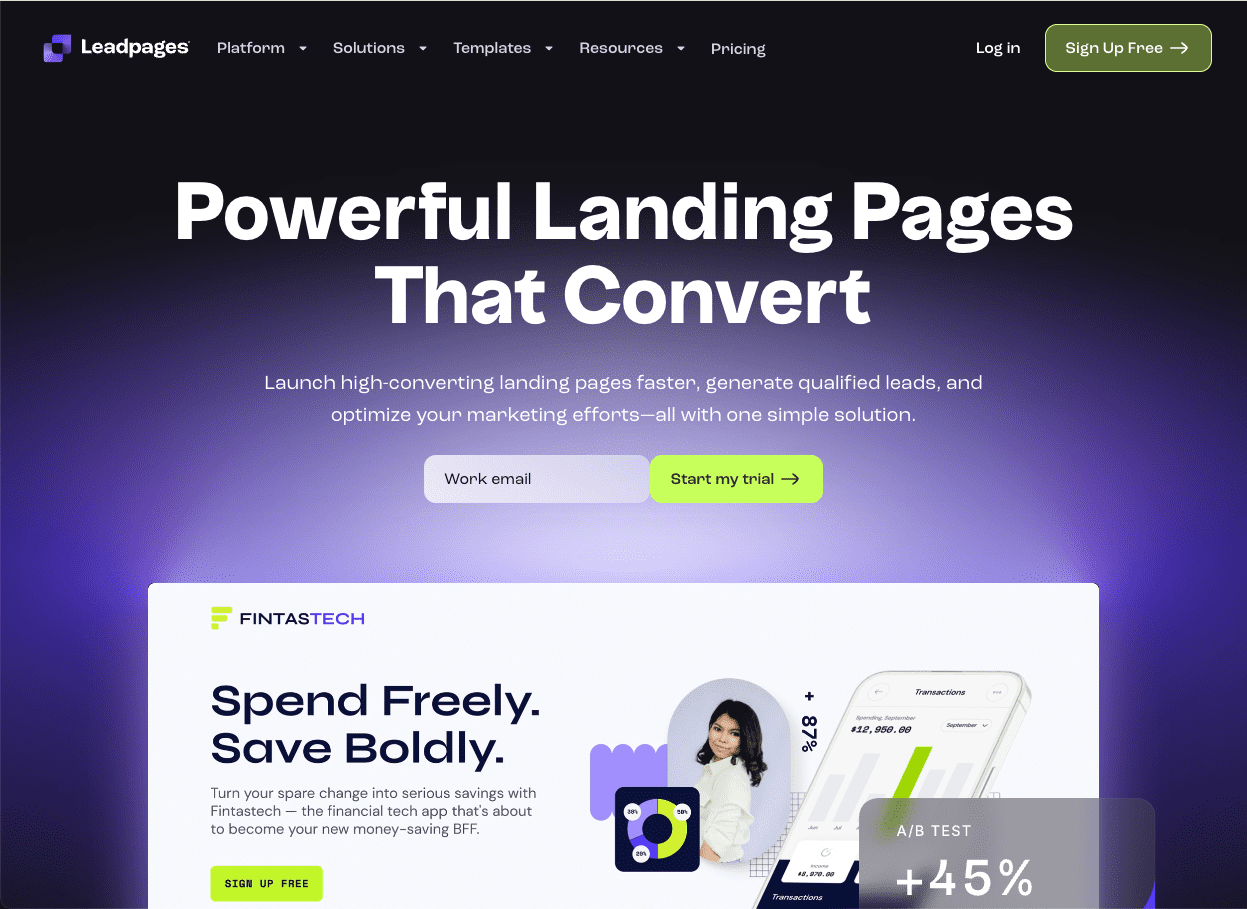
2. Leadpages
Best for: Small businesses and entrepreneurs looking to generate sales.
Screenshot from Leadpages.com, December 2025
Need a landing page that will help you generate sales? Consider taking a look at Leadpages.
Its strength lies in its user-friendly, drag-and-drop editor and an extensive collection of templates that streamline the page-building process. Plus, according to the Leadpages website, it’s a platform that converts five times better than the industry average.
Leadpages offers CRO tools, real-time analytics, and A/B testing capabilities, enabling users to effectively enhance page performance.
Its various widgets let you add videos, images, forms, and even payment integrations directly to your landing pages, making it a versatile tool for businesses that want to combine content with sales functionality.
On top of all this, Leadpages now includes an AI Engine for creating headlines and images and an AI writing assistant with full access available to Pro accounts, which can help you write better content.
Pros:
Intuitive no-code editor and easy payment integration.
Comprehensive A/B testing and real-time analytics.
Extensive template library with over 200+ options.
Cons:
Higher cost compared to some alternatives.
Limited ecommerce features.
Some users report mobile responsiveness issues.
Pricing:
The standard plan starts at $49/month (billed monthly) for one custom domain, unlimited traffic, and leads.
More advanced features are available in higher-tier plans, which start at $99/month (billed monthly). You can save 25% when billed yearly.
What Users Say
Leadpages is recommended primarily for conversion. When asked on subreddit r/Solopreneur about Leadpages vs. Wix, user Straight_Tooth4294 replied, “I’d honestly go with Leadpages or Instapage – they’re built for conversion and specifically for landing pages.” When asked if realtors use the tool on r/marketing, user patrick24601 replied, “Leadpages is good for landing/squeeze pages. Most realtors don’t need those.”
But other users have expressed dismay that Leadpages raised their rates and doesn’t have great customer service. Redditor constantineinamerica wrote, “I would favor Wix or Unbounce over Leadpages. I’ve known lots of people who have had terrible customer service experiences with Leadpages.” and user Abroja seconded, sharing, “Been with Leadpages for over 5 years. They just raised the rates huge overnight but it’s ok because they ‘sent us an email’.”
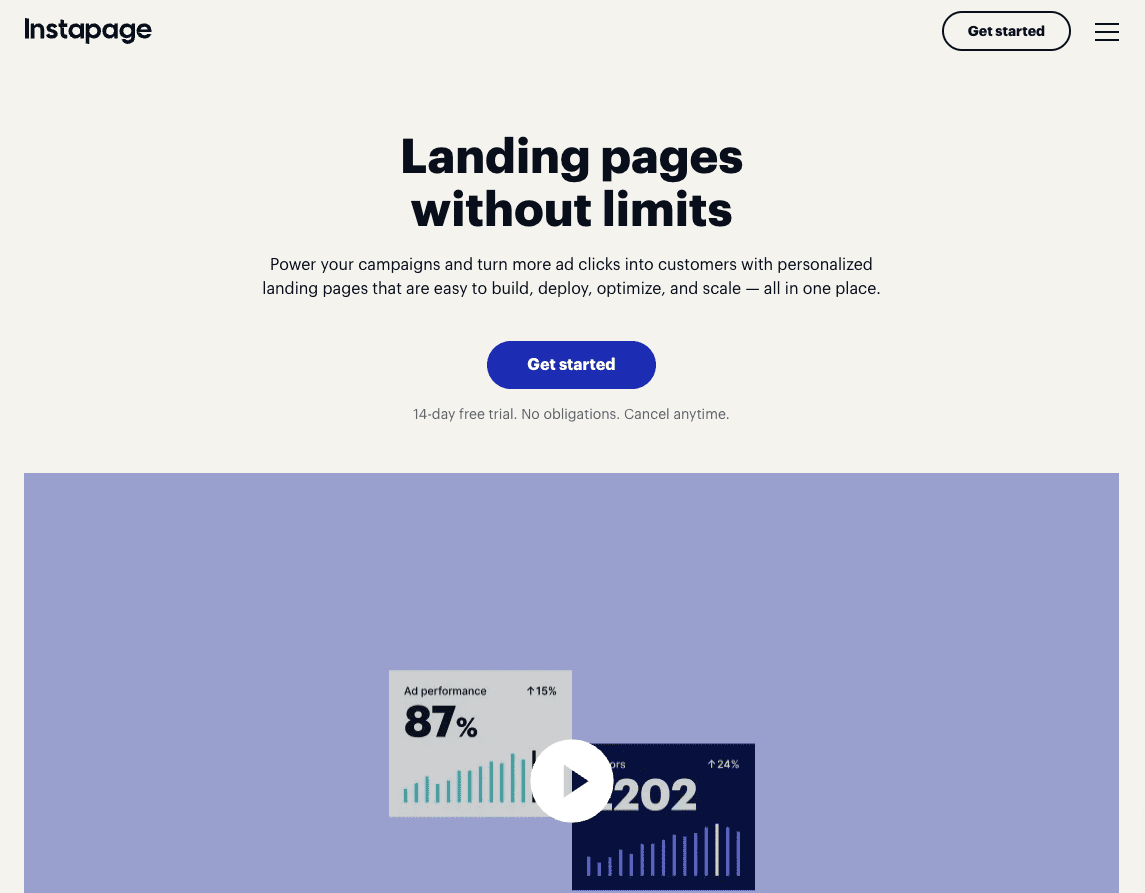
3. Instapage
Best for: Large businesses, marketing teams, or agencies that require collaboration and advanced optimization features.
Screenshot from Instapage.com, December 2025
If you’re seeking a more high-end landing page platform, Instapage might be the one for you. It offers advanced features tailored for professional marketing teams and agencies with a need to create optimized landing pages at scale.
In addition to a drag-and-drop builder and plenty of high-quality templates, Instapage offers a bevy of features, including advanced cloud-based team collaboration tools, heatmaps for user engagement analysis, robust A/B testing capabilities, AI-generated content creation, and more.
One of its standout features is Instablocks & Global Blocks, which lets users create custom page components that can be easily reused across projects, and then update hundreds or thousands of pages in one go.
Instapage supports advanced marketing goals with features like AdMap, which lets you view your overall campaigns, ad groups, and ads, then align them with relevant landing pages. Plus, its mobile-friendly design ensures a fast, seamless user experience.
While Instapage offers a premium experience with its comprehensive set of tools and features, its higher price point and complex functionalities may be a barrier for smaller businesses or those new to landing page optimization.
Pros:
Extensive customization with a library of professional templates.
Instablocks for efficient design and asset reuse.
Effective team collaboration features.
Cons:
Premium pricing will be a barrier for many businesses.
Steep learning curve for utilizing advanced features.
Limitations in reporting and visitor tracking for lower-tier plans.
Pricing:
The Create plan starts at $99/month (billed monthly). Plans cost up to 20% less if paid monthly vs. annually, with a 14-day free trial.
Customers will need to upgrade to a customized Convert plan to access more advanced features, such as root domain publishing, heatmaps, and more.
What Users Say
While Instapage’s pricing is on the steeper side, especially if you’re just getting started, it is considered one of the best platforms for high-converting landing pages, according to user JeanetteChapman, “It’s really geared more toward businesses running serious paid traffic campaigns where optimizing every click matters. If you’re spending at least a few thousand a month on ads, it’s worth it.”
One user named Rina-Lanaudiere-5, who made the switch from Unbounce to Instapage, was pleased with its A/B testing feature, “We’ve checked them out, quite quickly realized Instapage is much more obvious and easy for all to handle and made the move, that’s it. Doing A/B testing all the time, super handy.”
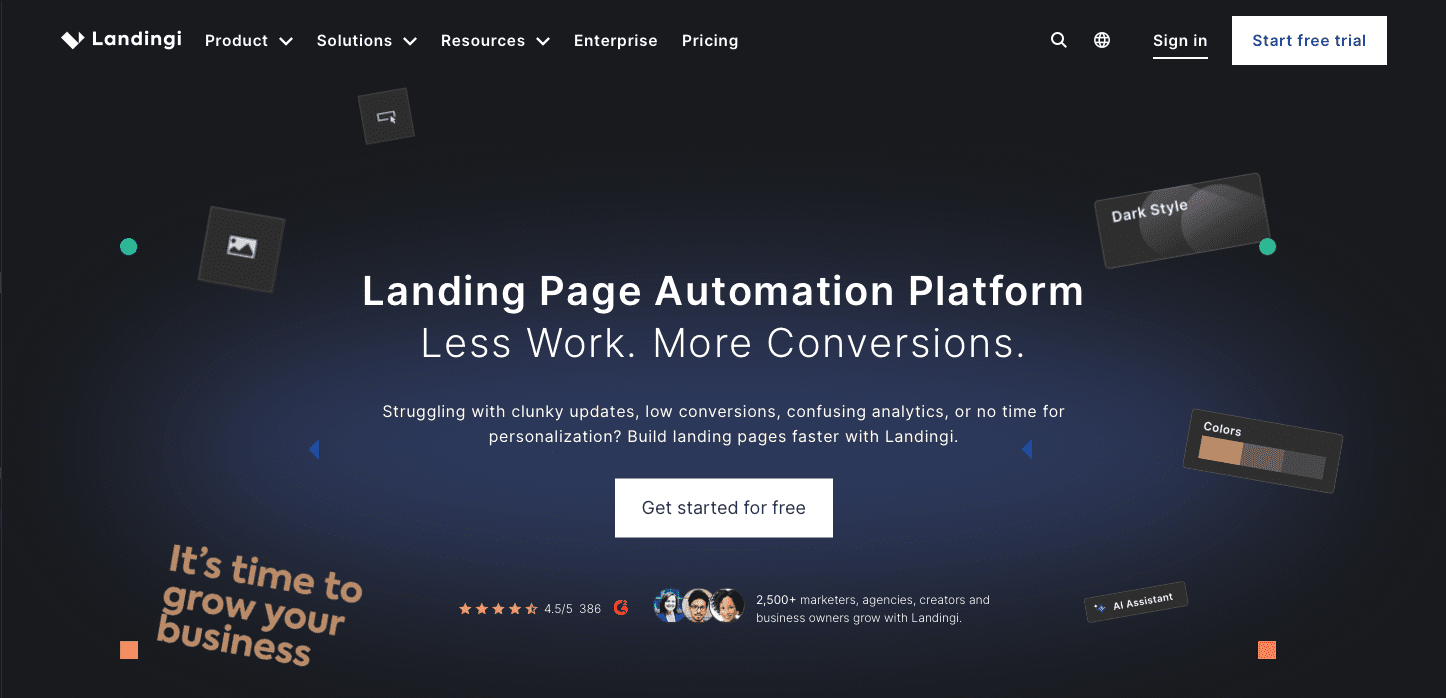
4. Landingi
Best for: From online shops with international customers to enterprise businesses seeking a versatile landing page solution with a wide range of features.
Screenshot from Landingi.com, December 2025
If you’re in the market for versatility, Landingi is worth investigating. Landingi offers a flexible, comprehensive landing page builder with robust features, including an advanced editor, pop-ups, A/B testing, and a library with hundreds of templates.
Its Composer AI feature lets you skip writer’s block and quickly fill your pages with a ready-to-publish structure. With Smart Sections, you can also easily update specific page elements across multiple designs, saving time and headaches.
One of their attractive features is that you can translate your landing pages into 29 languages to scale your campaigns worldwide.
Designed to serve businesses of all sizes, Landingi’s simple, drag-and-drop builder can help you create and optimize various types of landing pages – and if you have any HTML and CSS knowledge, it can be a pretty impressive editor.
Landingi is a particularly strong choice for international businesses looking to target different customer segments with unique landing pages. With over 170 integrations with tools, including payment gateways like Stripe, it’s a great choice for companies looking to sell products.
While its rich feature set can be overwhelming for newcomers, creating pages might take a bit longer than on other platforms, the level of customization and control it offers makes Landingi one of the best landing page builders out there.
Pros:
Extensive template library with 400+ customizable options.
Powerful editing capabilities with Smart Sections for efficient design.
Broad integration with various apps, including payment systems.
Cons:
Steeper learning curve for beginners.
Potentially longer time to create landing pages compared to simpler platforms.
Pricing:
Landingi offers a free option with five active landing pages, 100 conversions, and 100 visits per month.
The Lite plan starts at $29/month (billed monthly) and includes 10 active landing pages, unlimited conversions, 5,000 visits per month, and one custom domain. Paid plans go up to $1,399 with a 14-day free trial for all plans.
Landingi also offers Professional and Enterprise tiers with more advanced features and capabilities.
What Users Say
User dejka_writes recommends this platform for businesses working at scale: “We were pumping out dozens of landing pages for ppc and webinars every month, and the editor didn’t choke even when pages got a bit heavy. I personally loved the smartsections thing because it saved hours when updating multiple pages at once.”
However, there are still not many reviews about it on Reddit, with one unanswered user, islandviewgirls, still left wondering and posting about it, stating, “For price point and ease of use, I really like the Landingi platform, but I don’t see much here on Reddit about it. They are dominant in Europe so perhaps that’s why.”
Full Site Builders That Include Landing Pages
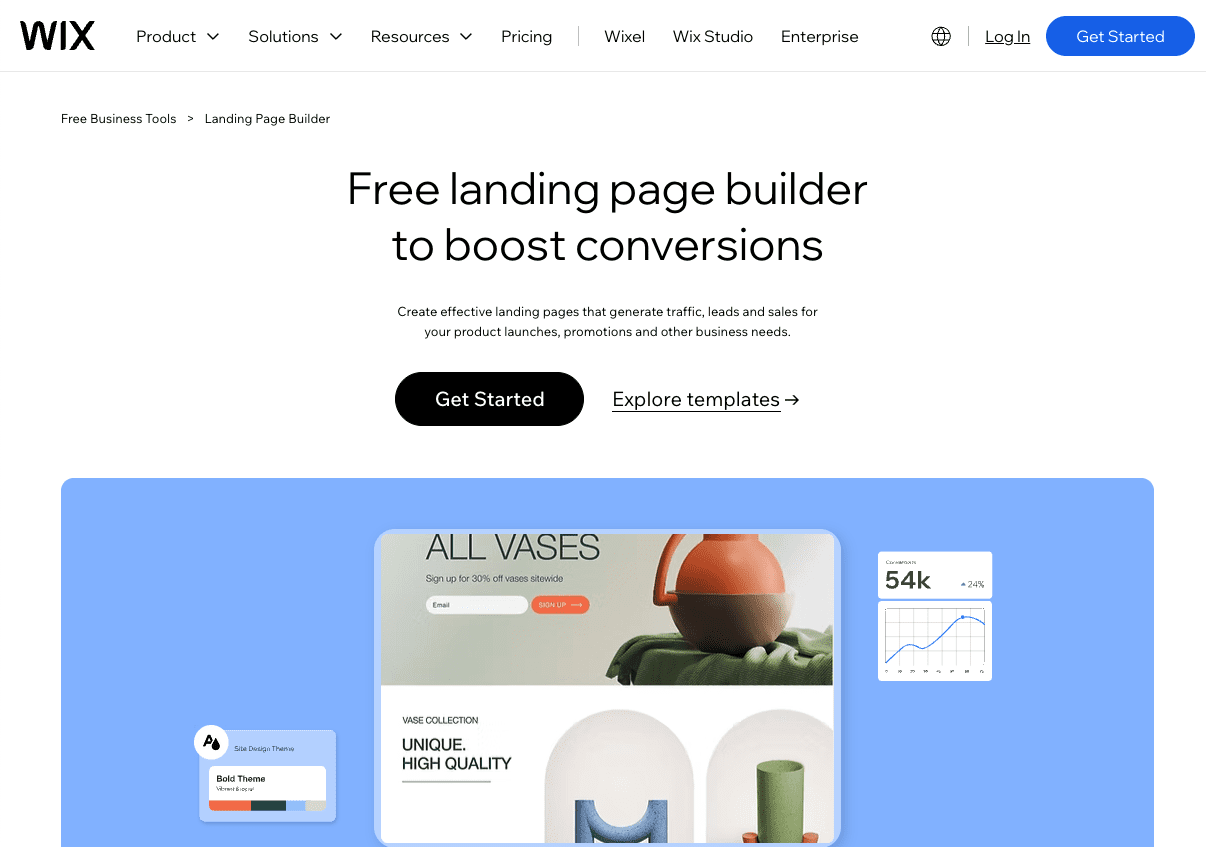
5. Wix
Best for: Individuals and small businesses seeking creative control without advanced coding.
Screenshot from Wix.com, December 2025
Now for something much more accessible: Wix is renowned for its user-friendly platform, which is ideal for creating attractive landing pages with minimal effort.
Like other options on this list, Wix offers an accessible drag-and-drop editor and a range of existing templates to help users craft aesthetically pleasing and functional landing pages.
Wix’s platform has a reputation for being particularly beginner-friendly, with a low learning curve and a free plan to help new users get started without any upfront investment.
While it offers a free starter plan, accessing more advanced functionalities and removing Wix ads requires upgrading to a paid subscription.
Wix’s balance of user-friendly design tools, ecommerce support, and cost-effective pricing makes it a favorable option for those new to web design or businesses needing straightforward, visually appealing landing pages.
Pros:
User-friendly with an intuitive drag-and-drop interface.
Free plan available, making it accessible for beginners.
Ecommerce capabilities with extensive payment integration.
Cons:
Advanced features and an ad-free experience require a paid plan.
Potential limitations in customization for complex requirements.
Site speed may decrease with more intricate designs.
Pricing:
A free plan is available, but it includes Wix branding and lacks more advanced features like payments.
Paid plans start at $17/month and offer additional features, including storage space; only the Business Elite option at $159 offers unlimited storage.
What Users Say
Wix has been praised for its ease of use; its drag-and-drop functionality with templates is highly useful, especially for those who can’t afford to hire a web designer or don’t know how to build from scratch. And according to a user named chmillout, who switched to Wix, said: “[I] think Wix is hard if you will [build] a website from scratch, and easy if you choose a template.”
However, there are complaints about its inconsistencies in scaling, as user cchurchill1985 commented on a poster who was being interviewed by Wix, “Can you tell them to add ‘scale proportionally’ to it?”
Some users have complained about substantial price increases, like poster chii-x3. Also, keep in mind a difficult migration, like thefanum explains, if you choose to leave the platform: “So if you build with them, then decide you want to take your website elsewhere (a simple process with normal hosts), you get to redo your entire website from scratch. Because you don’t own the code, they do.”
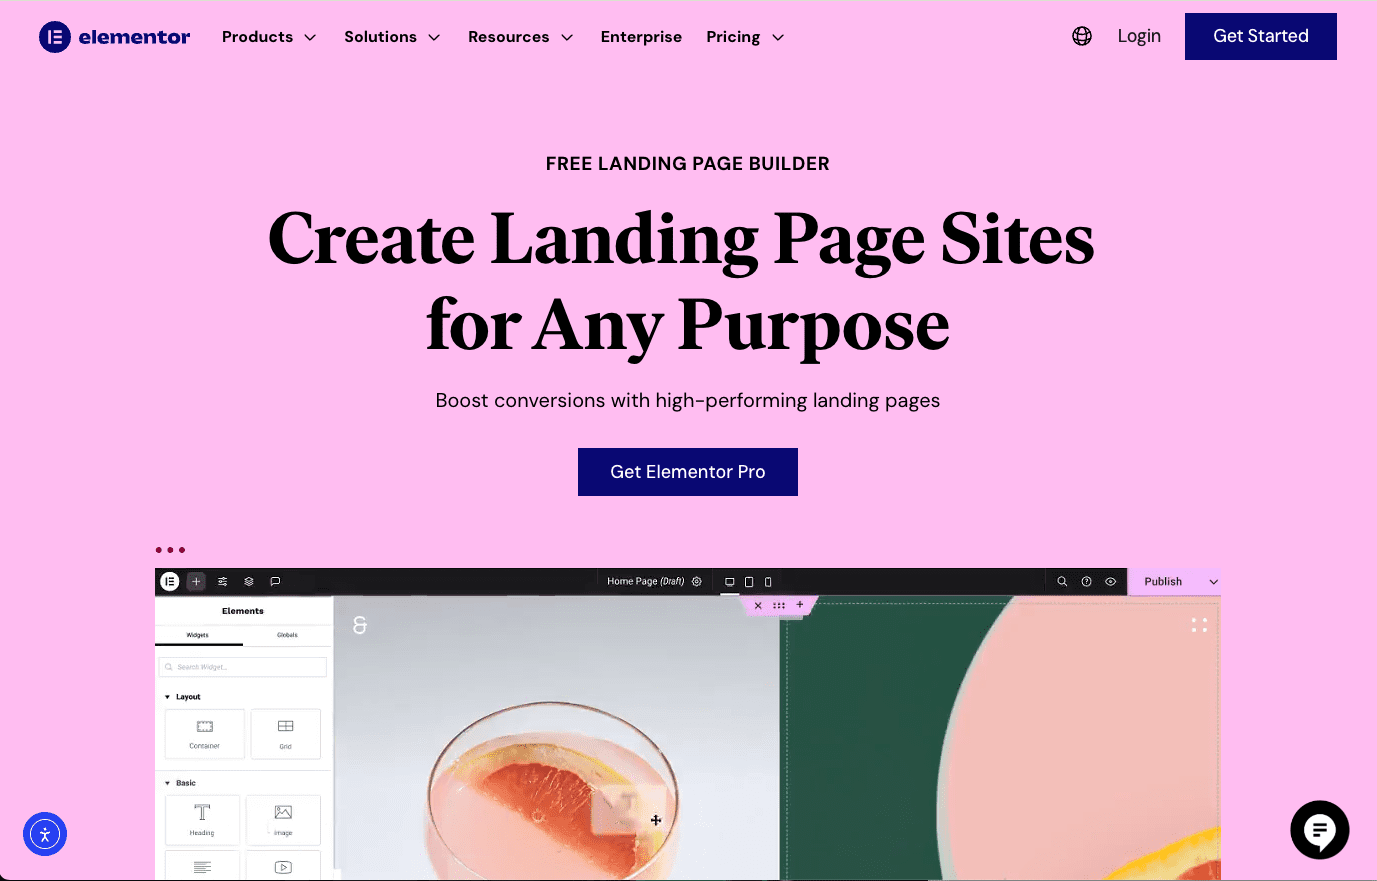
6. Elementor
Best for: WordPress users looking for a powerful and intuitive landing page builder.
Screenshot from Elementor.com, December 2025
If you’re a WordPress user, you’ll want to know about Elementor.
It’s a mainly WordPress page builder that’s gained popularity for its flexibility, comprehensive customization, and user-friendly interface.
Elementor allows users to design dynamic, detailed landing pages in WordPress. This feature makes it the perfect choice for WordPress users who want to extend their website’s functionality with sleek landing pages that maintain a consistent look and feel with their existing content.
Its real-time editing features provide immediate feedback on design changes without coding.
It also offers dozens of designer-made templates to choose from. You can add custom forms and pop-ups to your landing page, save page components for reuse, and seamlessly integrate with your customer relationship management (CRM) tools to create a powerful customer experience.
While Elementor offers a ton in terms of design flexibility and integration, it’s important to note that it’s exclusively for WordPress users and can be resource-intensive, which might impact site performance, especially on more complex websites.
Pros:
Advanced customization and design flexibility.
Real-time editing and instant feedback.
Seamless WordPress integration.
Cons:
Exclusively for WordPress users.
Potentially impacts site performance due to resource intensity.
Pricing:
Free version with limited functionality.
Paid versions of the Elementor plugin (assuming you are already a WordPress user and don’t need the full hosting package or WooCommerce bundles) start at $4.99/month billed annually (around $60 for the base plan) and include advanced features and support.
What Users Say
There is a definite learning curve with Elementor, but graphic designers like FeedMeMoreOranges love it, exclaiming, “I know my way around html/css but Elementor does the job well without having to develop a full site from the bottom up.”
However, some users like tracedef say, “It’s code and resource-heavy, which can lead to performance issues and higher requirements for memory at the server level. Poor hosting will compound these issues.”
Creator-Focused Simple Pages
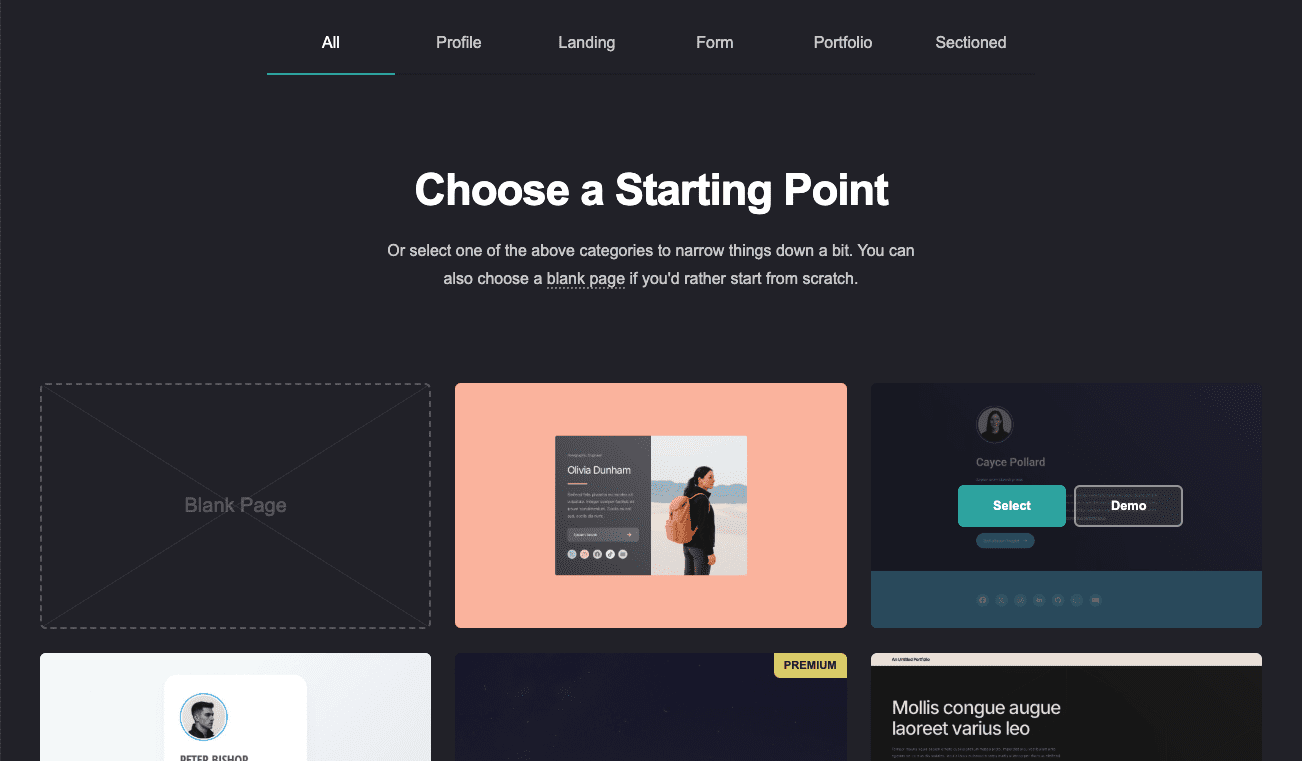
7. Carrd
Best for: Simple projects, personal use, and small budgets.
Screenshot from Carrd.com, December 2025
Looking for a great landing page builder that won’t break the bank? Look no further than Carrd.
Carrd is a streamlined landing page builder that lets you create single-page websites quickly and easily. It’s designed for simplicity, making it ideal for anyone who wants to quickly create a webpage without building a multi-page site.
Think portfolios, personal profiles, project presentations, and small business showcases.
Carrd’s user-friendly interface and selection of themes allow users to create sleek pages in the blink of an eye without even needing an account – you can just visit the website, pick a theme, and get started. However, you will need to sign up to save or publish your site.
It balances simplicity and functionality to help you craft pages that are clean, focused, and responsive across all devices. If you’re just testing the waters or working with slim budgets, this is the right tool for you.
Pros:
Extremely affordable, with a free tier available.
Intuitive and user-friendly interface.
Responsive design.
Fast and lightweight, making it ideal for quick and simple sites.
Cons:
Limited to single-page websites.
Restrictive layouts/themes, which limit creative freedom.
Lacks advanced features and integrations found in more comprehensive builders.
Pricing:
Carrd’s free basic plan allows you to launch three sites with Carrd branding to .carrd.co domains.
Paid plans range from $9 to $49 per year and offer additional features such as no Carrd branding, custom domains, and Google Analytics support (depending on your membership tier).
What Users Say
Its simplicity is what users love about it, making it the best platform to try out ideas for purely one-page landing sites, according to a user named readingisfun, and they further exclaim, “SO MUCH EASIER than WordPress (without the Search capability). I LOVE CARRD. I hope you give it a try and tell us what you think.”
However, for those seeking more complex functions for analytics, as Alternative-Put-9978 puts it well: “It lets you add a couple of meta tags on Pro and a GA4 tag. but that’s about it. it does not do anything complex, it’s more a landing page type site or for trying out ideas. there is no database backend…”
Choosing The Right Landing Page Builder For Your Business
To help you choose between the top options, here are some considerations while you make a decision:
Marketing Objectives: What’s your goal? Is it to have readers sign up for your newsletter, generate leads for your product, or promote your product launch? Page builders have different use cases, so choose one that aligns with your vision.
Ease Of Use: If you are a beginner with no coding knowledge, you may want a simple drag-and-drop editor and ready-to-use templates. Or it could be that you’re looking for something that can be tweaked with your years of coding experience. Whichever one it may be, it should be fit for purpose.
Integration Needs: Do you want your landing pages to integrate with other software or tools you already use for your CRM or email marketing, enabling automation? Or are you starting from scratch and are open to more affordable builders without them?
SEO Features: For some, going the extra mile to add meta tags and alt text to images to enhance accessibility is highly important for discovery. You may also want one that offers A/B testing and heat mapping to know exactly what to optimize to boost conversions.
Mobile Optimization: It’s essential that your landing pages cater to mobile users, so make sure your builder considers that with features like responsive design.
Budget: Unfortunately, budget matters. Landing page builders come with various price tags depending on their capabilities and features. Make sure you’re working within your budget.
There’s A Landing Page Platform To Help You Convert Visitors
Choosing the right landing page builder for your business can significantly impact your marketing success, but the decision depends on your specific goals, needs, and budget.
As we’ve explored, each tool has unique strengths and caters to different aspects of the landing page creation and optimization process.
Whether you’re looking for advanced design capabilities, a client-friendly, user-friendly interface, or specific functionalities like CRO or SEO plugins baked into it, the right platform can not only streamline your landing page design process but also convert visitors into loyal customers.
The world waits with excitement and anticipation for the arrival of Santa Claus as he starts his world tour for 2025.
Children (and adults) everywhere are eager to track the man in the red suit as he defies the speed limit to make his journey across the globe in just one night.
To help you keep up to date on what time Santa will arrive in your neighborhood, there are now two portals you can use to follow the sleigh.
The original Santa tracker from NORAD tracks Santa’s sleigh as he starts his busy night shift at the International Date Line in the Pacific Ocean and heads across the world towards New Zealand and Australia.
Google also has an interactive website and mobile app so users can follow Old Saint Nick’s journey as he delivers presents worldwide until he finishes in South America after the world’s longest night shift.
NORAD Santa Tracker: A Holiday Tradition
For over 65 years, the NORAD Santa Tracker has helped families follow Santa’s whereabouts.
The NORAD Santa Tracker began in 1955 when a misprinted phone number in a Sears advertisement directed children to call NORAD’s predecessor, the Continental Air Defense Command (CONAD), instead of Santa.
Colonel Harry Shoup, the director of operations, instructed his staff to give updates on Santa’s location to every child who called.
On Christmas Eve, the live map will display Santa’s current location and next stop.
For a more traditional experience, call the NORAD Tracks Santa hotline at 1-877-HI-NORAD (1-877-446-6723) to speak with a volunteer who will provide you with Santa’s current location.
Follow NORAD’s social media channels for regular daily updates.
This year, NORAD has added an AI chatbot called Radar to help you get the latest updates.
The Evolution Of Google’s Santa Tracker
Since it launched in 2004, Google’s Santa Tracker has changed and improved. The team uses this project to try out new technologies and make design updates. Some of these new features, like “View in 3D,” are later added to other Google products and services.
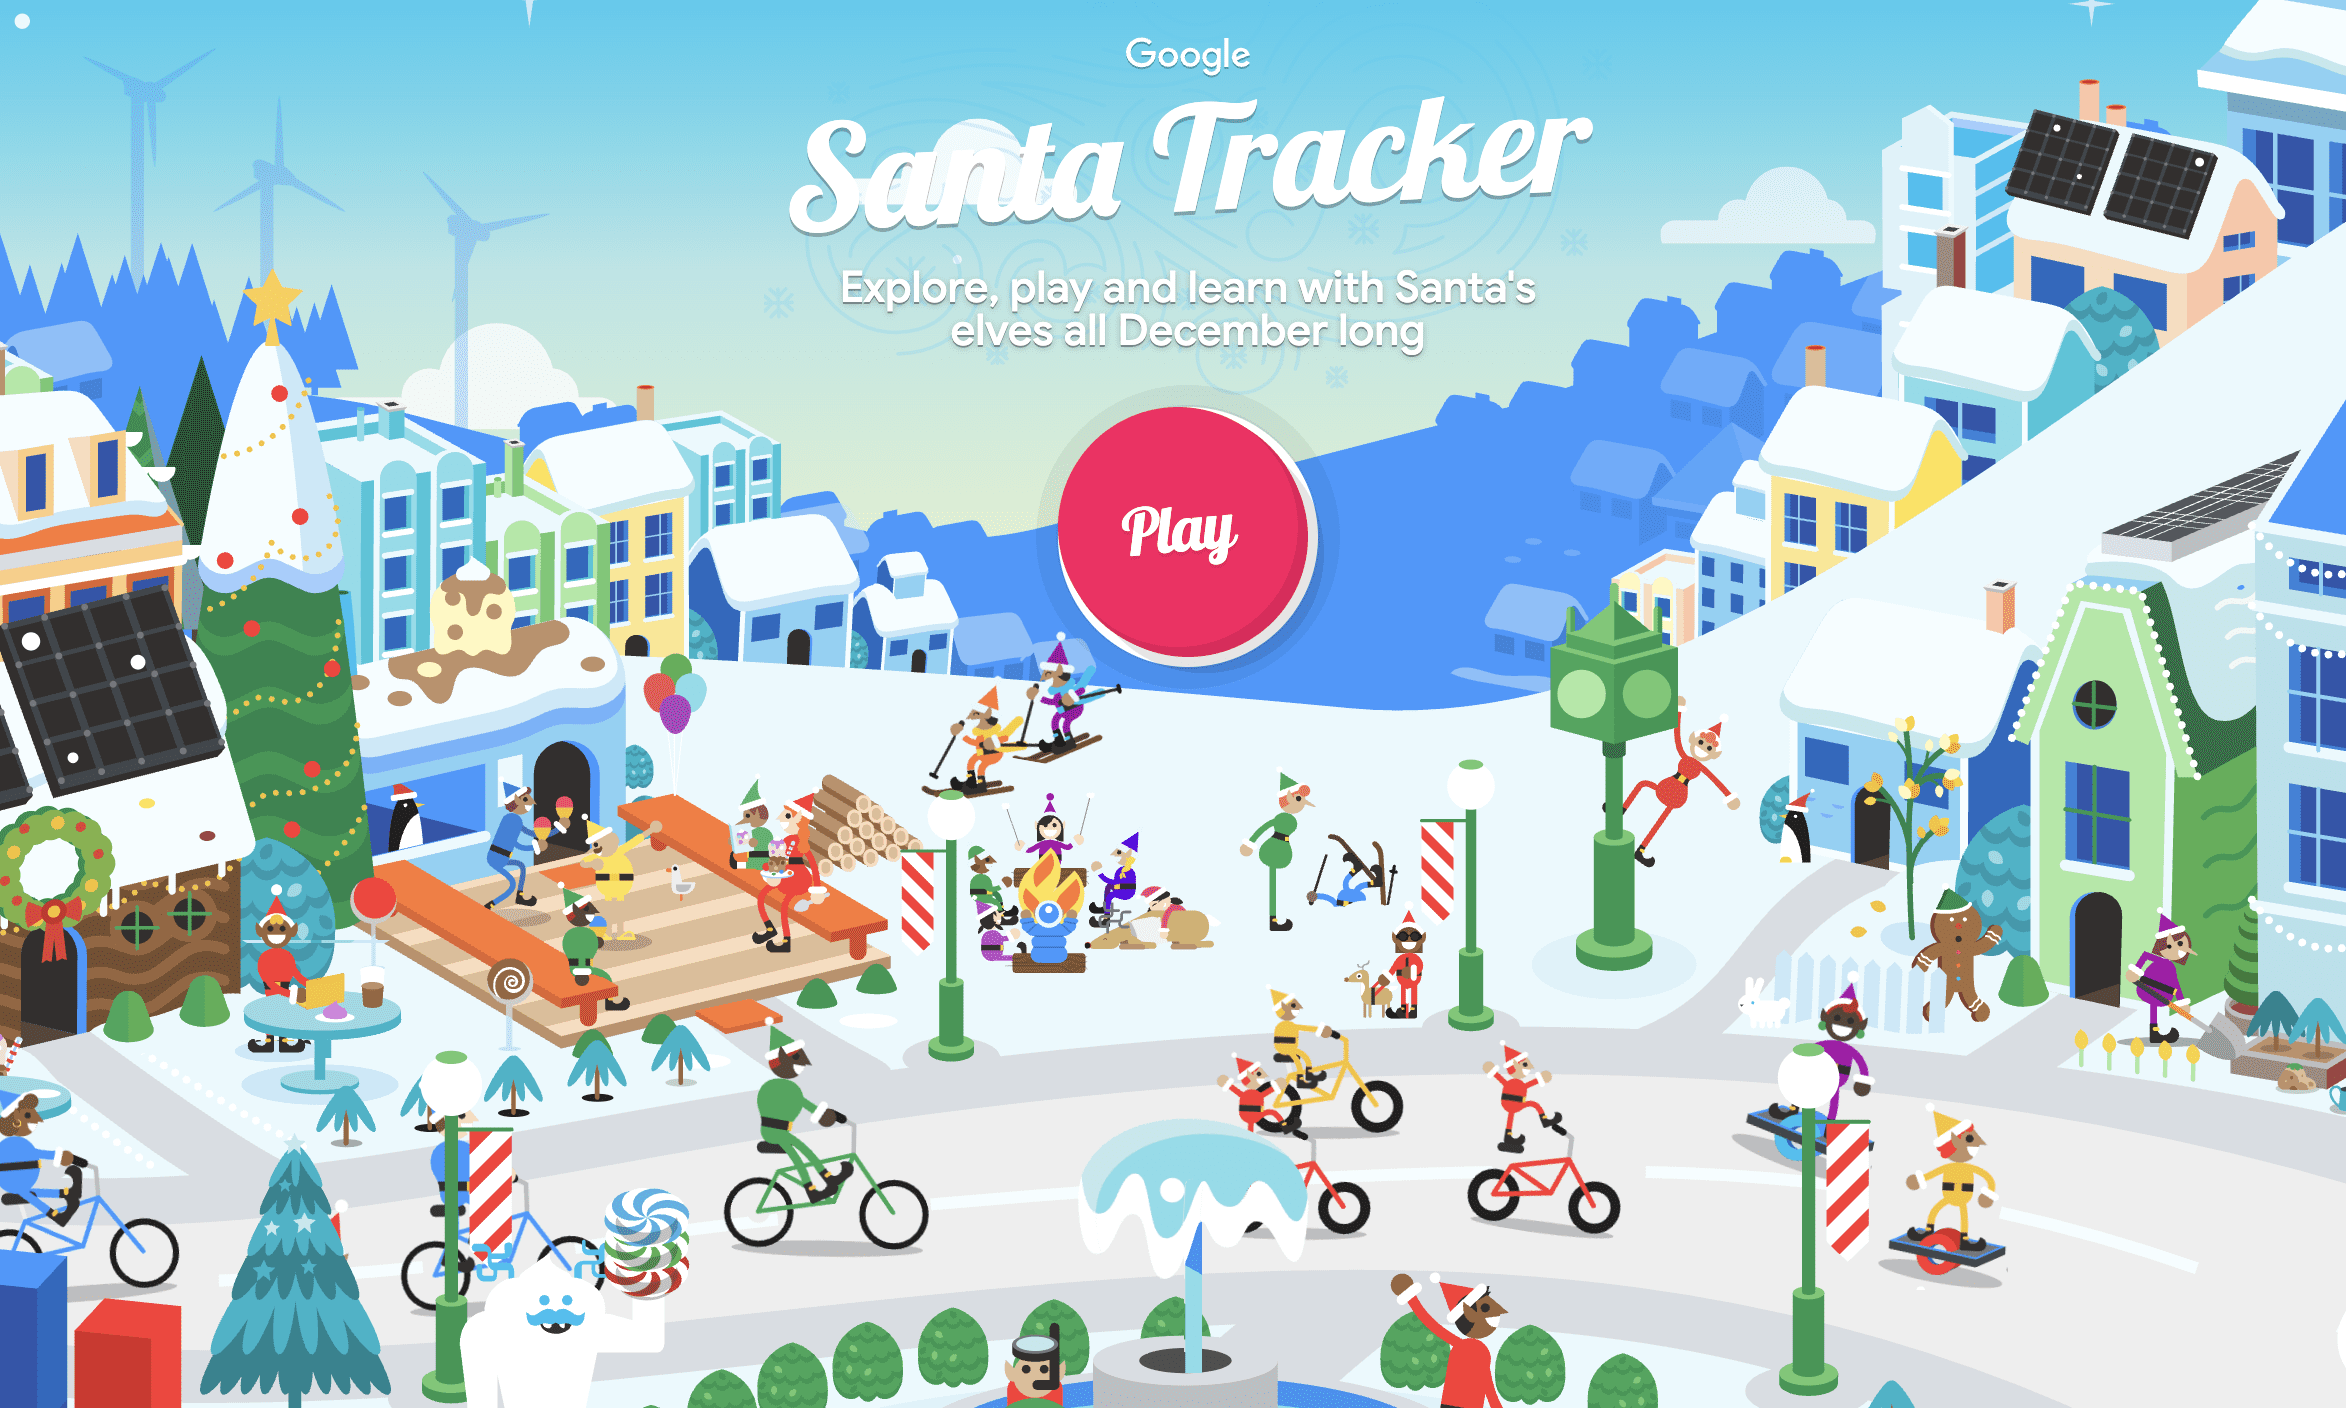
What’s In The 2025 Google Santa Tracker
Screenshot from santatracker.google.com/, December 2025
Google’s Santa Tracker returns for its 21st year with the familiar village experience you know and love. The site features games, videos, and activities throughout December, with the live tracker launching on Christmas Eve.
This year’s collection includes classics like Elf Ski and Penguin Dash alongside creative activities like Santa’s Canvas and Code Lab. Google uses the Santa Tracker project to test new technologies that often make their way into other Google products.
On Christmas Eve, the live map shows Santa’s current location, where he’s heading next, his distance from your location, and an estimated arrival time. The tracker begins at midnight in the furthest east time zone (10:00 a.m. UTC) as Santa starts his journey at the International Date Line in the Pacific Ocean.
For each city Santa visits, the tracker displays Wikipedia excerpts and photos, turning the experience into a geography lesson wrapped in Christmas magic.
How To Use The Google Santa Tracker
Visit the Google Santa Tracker website or download the mobile app for Android devices.
On Christmas Eve, the live map will show Santa’s current location, the number of gifts delivered, and his estimated arrival time at your location.
Explore the map to learn more about the 500+ locations Santa visits, with photos and information provided by Google’s Local Guides.
Extra Features & Activities
Beyond games, the platform showcases detailed animated environments ranging from cozy kitchens where elves prepare holiday treats to snowy outdoor scenes filled with winter activities.
The experience is wrapped in Google’s characteristic bright, cheerful art style, with colorful illustrations that bring North Pole activities to life.
Whether practicing basic coding concepts or learning holiday traditions from around the world, kids (and big kids) can explore while counting down to Christmas.
To All, A Good Night
Settle down for the evening tonight with your choice of favorite Christmas snack and follow Santa’s journey with either Google or NORAD.
Santa has an estimated 2.2 billion homes to visit, so it’s going to be a busy night tonight! Don’t forget to leave out your carrots and mince pies.
Happy holidays from all of us at Search Engine Journal!
Google sued SerpApi in the U.S. District Court for the Northern District of California, alleging the company developed methods to bypass protections Google deployed to prevent automated scraping of Search results and the licensed content they contain.
Why This Case Is Different
Unlike previous cases that focused on terms-of-service violations or broader scraping methods, Google’s complaint is built on DMCA anti-circumvention claims.
Google argues SearchGuard is a protection measure that controls access to copyrighted works appearing in Search results. The complaint describes SearchGuard as a system that sends a JavaScript “challenge” to requests from unrecognized sources and requires the browser to return specific information as a “solve.”
Google says the system launched in January and initially blocked SerpApi. The complaint claims SerpApi then developed ways to bypass it.
The complaint document reads:
“Google developed and deployed a technological measure, known as SearchGuard, that restricts access to its search results pages and the copyrighted content they contain. So that it could continue its free riding, however, SerpApi developed a means of circumventing SearchGuard. With the automated queries it submits, SerpApi engages in a wide variety of misrepresentations and evasions in order to bypass the technological protections Google deployed. But each time it employs these artifices, SerpApi violates federal law.”
Why DMCA Section 1201 Is The Center Of The Complaint
Google’s complaint leans on DMCA Section 1201, which targets circumvention of access controls and also the sale of circumvention tools or services.
Google is bringing two claims: one focused on the act of circumvention (Section 1201(a)(1)) and another focused on “trafficking” in circumvention services or technology (Section 1201(a)(2)). The complaint says Google may elect statutory damages of $200 to $2,500 per violation.
The filing also argues that even if damages were awarded, SerpApi “reportedly earns a few million dollars in annual revenue,” and Google is seeking an injunction to stop the alleged conduct.
What Google Claims SerpApi Did
Google claims SerpApi circumvented SearchGuard in multiple ways, including misrepresenting attributes of requests (such as device, software, or location) to obtain authorization to submit queries.
The complaint quotes SerpApi’s founder describing the process as:
“creating fake browsers using a multitude of IP addresses that Google sees as normal users.”
Google estimates SerpApi sends “hundreds of millions” of artificial search requests each day, and says that volume increased by as much as 25,000% over two years.
The Licensed Content Angle
Google’s issue is not just “SERP data.” It centers on copyrighted content embedded in Search features through licensing and partner relationships.
The complaint says Knowledge Panels “often contain copyrighted photographs that Google licenses from third parties,” and it points to other examples like merchant-supplied product images in Shopping and third-party imagery used in Maps.
Google alleges SerpApi “scrape[s] this copyrighted content and more from Google” and resells it to customers for a fee, without permission or compensation to rights holders.
Why This Matters For SEO Tools
If your workflows depend on third-party SERP data (rank tracking, feature monitoring, competitive intelligence), this case is worth watching because Google is asking for an injunction that could cut off a source of automated SERP access.
Bigger vendors typically run their own collection systems. Smaller products, internal dashboards, and custom tools are more likely to depend on outside SERP APIs, which can create a single point of failure if a provider is forced to shut down or change methods.
Industry Context: Scraping Lawsuits Are Increasing
Google’s filing follows other litigation over scraping and content reuse.
Reddit sued SerpApi and other scraping companies in October over alleged scraping tied to Perplexity, but also notes Perplexity isn’t mentioned in Google’s lawsuit.
Antitrust Context, Briefly
This also lands after Judge Amit Mehta’s August 2024 liability ruling in the U.S. search antitrust case, with remedies ordered in 2025 and appeals expected.
That case deals with distribution and defaults. This one is about automated access to Search results pages and the content embedded in them. Still, they both sit inside the same broader debate about how much control platforms can exert over access and reuse.
What People Are Saying
Some reaction on X has framed the lawsuit as an existential threat to AI products that depend on third-party access to Google results, with one post calling it “the end of ChatGPT.”
The court filing and Google’s announcement are narrower, focused on SerpApi’s alleged circumvention of SearchGuard and the resale of copyrighted content embedded in Google Search features.
SerpApi, for its part, says it will “vigorously defend” the case and characterizes it as an effort to limit competition from companies building “next-generation AI” and other applications.
What Comes Next
Google is asking the court for monetary damages and an order blocking the alleged circumvention. It also wants SerpApi compelled to destroy technology involved in the alleged violations.
If the case proceeds, the central issue is whether SearchGuard qualifies as a DMCA-protected access control for copyrighted works, or whether SerpApi argues it functions more like bot-management, which it may contend falls outside Section 1201.
Google is rolling out an experimental feature that lets Search Console users configure the Search results Performance report using natural language instead of manual filter selection.
The feature, called AI-powered configuration, translates plain-language requests into the appropriate filters and settings. You can describe the analysis you want to see, and the system handles the technical setup.
What’s New
The AI-powered configuration feature handles three types of report setup:
1. Filters
You can narrow data by query, page, country, device, search appearance, or date range through natural language.
A request like “Show me queries on phone searches that contain the word ‘sports’ in the last 6 months” applies the relevant filters automatically.
2. Comparisons
Complex date range comparisons that previously required manual configuration can now be set up through prompts like “Compare traffic for my pages that contain ‘/blog’ in this quarter to the same quarter last year.”
3. Metric Selection
The feature can display specific combinations of the four available metrics (Clicks, Impressions, Average CTR, and Average Position) based on your requests.
For example, you can ask, “Show me the Average CTR and Average Position of my queries in Spain in the last 28 days.”
Limitations
Google noted several limitations.
The feature works only with Performance reports for Search results, it doesn’t support Discover or News reports.
AI-powered configuration is designed only for configuring filters, comparisons, and metrics. It can’t sort tables or export data.
Google also cautioned that the AI can misinterpret requests. You should review suggested filters before analyzing data to make sure they match the query you intended.
Why This Matters
This feature could reduce the manual effort required to set up complex filter combinations in Search Console.
The ability to request custom date comparisons or multi-filter configurations through natural language removes several steps from the reporting process.
The accuracy caveat matters, especially for higher-stakes reporting. You’ll want to verify that the AI understood your request correctly before you rely on the data for decisions or client reporting.
Looking Ahead
Google is rolling out AI-powered configuration to a limited set of websites and will expand availability over time. No timeline for broader access was provided.
Google announces delays in Search Console’s Page indexing report. The company confirms crawling, indexing, and ranking remain unaffected by the reporting issue.
Google is experiencing longer than usual delays in the Page indexing report within Search Console.
The issue affects reporting only, not actual crawling, indexing, or ranking of websites.
Google will provide an update when the issue is resolved.
Adobe and Semrush announced today that they have entered into a definitive agreement for Adobe to acquire Semrush in an all-cash transaction valued at approximately $1.9 billion. Adobe will pay $12.00 per share, describing Semrush as a “leading brand visibility platform.”
The acquisition brings a widely used SEO platform under Adobe’s Digital Experience umbrella.
The deal is expected to close in the first half of 2026, subject to regulatory approvals and the approval of Semrush stockholders.
What Adobe Is Buying
Semrush is a Boston-based SaaS platform best known in search marketing for keyword research, site audits, competitive intelligence, and online visibility tracking.
Over the past two years, Semrush has added enterprise products focused on AI-driven visibility, including tools that monitor how brands are referenced in responses from large language models such as ChatGPT and Gemini, alongside traditional search results.
Semrush has also been an active acquirer. Recent deals have included SEO education and community assets like Backlinko and Traffic Think Tank, as well as technology and media acquisitions such as Third Door Media, the publisher of Search Engine Land.
For Adobe, this gives the Experience Cloud portfolio a direct line into the SEO workflow that many in-house teams and agencies already use daily.
How Semrush Fits Adobe’s AI Marketing Stack
Adobe positions the deal as part of a broader strategy to support “brand visibility” in what it describes as an agentic AI era.
In the announcement, Anil Chakravarthy, president of Adobe’s Digital Experience business, says:
“Brand visibility is being reshaped by generative AI, and brands that don’t embrace this new opportunity risk losing relevance and revenue.”
Semrush’s “generative engine optimization” positioning aligns with that narrative. The company has been pitching GEO as a counterpart to traditional SEO, focused on keeping brands discoverable inside AI-generated answers, not just organic listings.
Adobe plans to integrate Semrush with products like Adobe Experience Manager, Adobe Analytics, and its newer Brand Concierge offering.
Deal Terms And Timeline
Under the terms of the agreement, Adobe will acquire Semrush for $12.00 per share in cash, representing a total equity value of roughly $1.9 billion.
Coverage from financial outlets notes that the price reflects a premium of around 77 percent over Semrush’s prior closing share price and that Semrush stock jumped more than 70 percent in early trading following the announcement.
According to the companies, the transaction has already been approved by both boards. An associated SEC filing shows the merger agreement was signed on November 18.
Closing is targeted for the first half of 2026, pending customary regulatory reviews and the approval of Semrush shareholders. Until then, Adobe and Semrush say they will continue to operate as separate companies.
Why This Matters
This deal continues a broader trend: core search and visibility tools are moving deeper into large enterprise suites.
If you already rely on Semrush, you can expect tighter integration with Adobe’s analytics and customer experience products over time.
It also raises practical questions:
How will Semrush be packaged and priced once it sits inside Adobe’s enterprise stack?
Can agencies and smaller teams keep using Semrush as a relatively independent tool?
How will Adobe choose to handle Semrush’s media holdings, including Search Engine Land and related properties?
For now, both companies are presenting the acquisition as a way to give marketers a more complete view of brand visibility across search results and AI-generated answers, rather than as a change to Semrush’s current product line.
Looking Ahead
In the near term, there are two things to watch.
First, regulators will review the transaction, particularly given Adobe’s history with large acquisitions in the digital experience space. That process will shape the closing timeline.
Second, Adobe will need to decide how quickly to integrate Semrush into Experience Cloud and how much to preserve the existing product and brand. Those choices will influence how disruptive this feels for your current workflows.
Watch for changes to Semrush’s API access, plan structure, and reporting integrations once the deal moves closer to completion.