Advertising attribution is supposed to identify and assign credit to the actions and campaigns that lead to conversions. One might surmise that the process is simple with digital ads and large language models.
It is not.
Even the best forms of multi-touch attribution (MTA) are inexact owing to privacy regulations, platform changes, and the messy way shoppers move between websites and even physical stores.
Predictive Advantage
Imagine a retailer running Meta ads to drive traffic to its site. Those ads might inspire shoppers to buy later at Amazon. Contemporary attribution never sees those sales, so the ads look unprofitable. The marketing team might cut the campaign, not realizing it boosted revenue elsewhere.
The result is a blind spot. Marketers often undercount investments that create awareness, while lower-funnel ads look like heroes.
Yet MTA is better than last-touch attribution, and last-touch is better than guessing. But the next step toward understanding the impact of ads and marketing may be a form of predictive modeling similar to media mix modeling (MMM), but with channel-level accuracy.
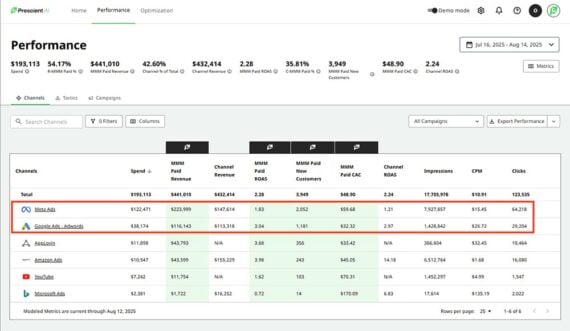
Predictive attribution modeling “will take you at least to the campaign level,” said Cameron Bush, vice president of digital transformation at Meyer, a cookware manufacturer, as he described his experience.
“I have one campaign in Meta right now that I’m looking at in [Prescient AI, an attribution platform], where 100% of its revenue and MMM ROAS is being driven by Shopify,” Bush continued.
“The [campaign] right below it is 50/50 between Shopify and Amazon and has slightly higher ROAS. That’s a level of sophistication that I wouldn’t have had,” said Bush, comparing predictive models to MMM and MTA.
Predictive AI forecasts each campaign’s impact on overall revenue, as illustrated by this example from Meyer. Click image to enlarge.
Decision-Making
Predictive modeling approaches the same goal as marketing mix modeling and multitouch attribution.
Instead of piecing together every customer touchpoint, it models the relationships between spend and revenue across channels. Then it simulates outcomes, combining MMM-style aggregate measurement with campaign-level outputs, informing marketers:
Influence of channels and campaigns on each other and overall revenue.
Impact of top-of-funnel campaigns on downstream revenue.
Effect of changes to promotional and marketing spend on profit.
The challenge is what to do with that info.
“We look at Excel spreadsheets. We look at dashboards. We look at all this kind of stuff, and it gives us a really good picture of what is going on today. But it doesn’t tell me what to do,” said Cody Greco, co-founder and chief technology officer at Prescient AI.
The work of answering “what should I do now?” is passed to the marketer to forecast.
“The cool thing about predictive modeling is it actually helps answer the next rational question,” Greco said.
A marketer can ask, say, what happens if she doubles her spend on Instagram, and receive an answer with a high degree of confidence.
Media Buying
Predictive modeling could affect retail media buying in a few ways.
Branding and content. Understanding how top-of-funnel promotions and content marketing aid advertising conversions may reinvigorate branding.
Budget clarity. Reallocate investments for the best returns.
Automation. Placing bids and adjusting spend could, eventually, become automatic.
Contemporary attribution often drags marketing teams into debates over detailed metrics. Predictive modeling reduces those arguments, freeing teams to focus on creative and campaign planning.
Shift in Focus
Hence marketers who delegate the tasks of identifying channels could achieve a renaissance in creativity and content, according to Meyer’s Bush.
To be sure, predictive modeling doesn’t erase uncertainty or replace marketers. Yet if successful, it will change promotions for ecommerce and omnichannel businesses.
Think of it like weather forecasting. Marketers will not explain every raindrop; they will focus on whether you’ll need an umbrella tomorrow.
Four years after Apple broke mobile app attribution in iOS 14.5, an emerging class of privacy-safe aggregated modeling tools promises to bring back visibility without tracking individuals.
The approach uses large sets of anonymized data to infer which advertising campaigns, mobile views, and cross-device activity led to revenue.
It is the method behind Apple’s SKAdNetwork, Google’s Integrated Conversion Measurement (ICM), Meta’s Aggregated Event Measurement (AEM), and tools such as Predictive Aggregate Measurement (PAM) from Branch, a marketing and measurement firm.
“Marketers don’t need to know who bought something — they need to know what drove the sale,” said Irina Bukatik, vice president of product at Branch. “Predictive Aggregate Measurement gives them that clarity in a way that’s compliant, privacy-safe, and works across both app and web.”
Branch’s Predictive Aggregate Measurement infers attribution from aggregate performance signals.
Why It Matters
Merchants that sell through multiple channels — mobile app, website, physical store — know the importance of understanding advertising’s impact on sales.
Apple’s iOS changes in 2021 created blind spots, especially for tracking users across devices and channels.
PAM, AEM, ICM, and similar systems close that attribution gap. These privacy-preserving tools analyze large datasets and estimate which ads and touchpoints are likely responsible for conversions. Thus marketers can tell if a mobile view influenced a desktop purchase or if an app install led to repeat orders, all without violating privacy.
The payoff is relatively better budget allocation, campaign optimization, and confidence that ad spend is going to the channels that generate revenue.
How It Works
Instead of capturing click-by-click records tied to a shopper, these privacy-compliant systems collect conversion signals in bulk and combine them with other relevant campaign data.
The tools do not track individuals, and some add “noise” to obscure personally identifiable information.
From there, statistical models look for patterns that suggest which ads, channels, or touchpoints are likely responsible for a sale.
The process is probabilistic, meaning the tool does not know that a specific customer saw an Instagram ad before buying, but it can conclude, with a high degree of confidence, that the campaign influenced sales based on aggregate trends, explained Branch’s Bukatik.
The models weigh several factors, presumably including:
Time between impressions and actions,
Number of conversions following a campaign,
Cross-device behaviors such as mobile views and desktop purchases,
Historical campaign performance under similar conditions.
Imagine the old connect-the-dot worksheets from elementary school that let you trace the shape of a cat or a butterfly. iOS 14.5 and similar privacy updates erased some of the dots, but higher math can help complete the picture.
Known Limits
Yet aggregated measurement is not a perfect replacement for the old, detailed, user-level tracking.
There are limits to the new systems’ accuracy.
Lower granularity. The tools lack the user-level detail of legacy tracking. Marketers cannot follow individual customer journeys end-to-end, complicating targeted, retargeted, or personalized campaigns.
Attribution delays. Frameworks such as Apple’s SKAdNetwork often delay reporting for privacy reasons. The result is slow optimization cycles, forcing marketing teams to wait before reallocating budget or testing new creative.
Thresholding. Some systems hide conversion data from smaller or niche campaigns until they reach a minimum volume to prevent identification. This too delays budget and creative decisions.
Limitations such as lower granularity are not as critical as they first appear. As Bukatik noted, in most cases “what a marketer wants to know is not whether someone clicked on the Facebook ad and purchased — it’s whether the Facebook ad drove the purchase.”
Adapting
For merchants, the continuing shift toward privacy-preserving aggregated measurement means building campaigns and reporting processes that work within the system’s constraints.
Start by focusing on bigger, more meaningful signals. Instead of chasing granular, click-by-click attribution across devices, set clear conversion events that matter, such as a first purchase, a new subscription, or a repeat order.
Consider these metrics as key performance indicators. Aggregated tools excel at gauging high-value actions.
Invest in creative and audience testing at the campaign level. A delay in reporting may require tests that run long enough to gather statistically significant results. Avoid overreacting to early data.
Blend first-party data from your ecommerce platform or loyalty program with aggregate reports. You won’t see individual journeys from ad click to checkout, but combining datasets can reveal channel lift, customer lifetime value, and repeat purchase behavior.
Finally, accept that modern attribution is increasingly probabilistic. The goal isn’t perfect precision but directional confidence — enough clarity to shift budget toward the channels, campaigns, and platforms likely to generate profitable growth.
My company helps merchants analyze and optimize marketing data. Clients’ most frequent questions involve attribution. What’s the source of truth? What drove the purchase? What prompted the visit to my site?
Let’s start with attribution tracking in Google Analytics.
Google Analytics
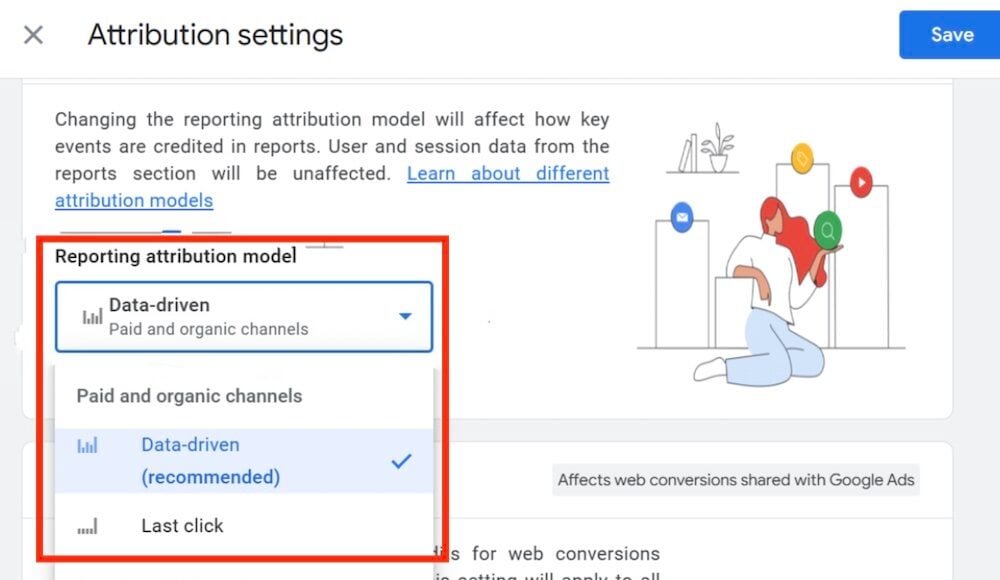
Google Analytics 4 now offers just two methods for attributing conversions:
“Data-driven” uses machine learning to distribute attribution across multiple sources based on users’ previous behavior, excluding direct traffic, although it appears to skew toward Google-owned channels.
Google Analytics 4 offers two methods for attributing conversions: “Data-driven” and “Last click.”
GA4 offers multiple attribution windows, depending on a business’s sales cycle. Some products require no research and are typically purchased in minutes. Others are complex and need much consideration. I typically set the window at 30, 60, or 90 days.
Rarely does an ecommerce platform’s conversion attribution reports match Google Analytics. Here’s why.
Technical errors, such as incorrect installation of pixels on Google or Meta ads, and mistakes with UTM parameters.
Privacy rules and regulations complicate tracking. Examples include the E.U.’s GDPR and cookie restrictions.
Non-digital promotions, such as ads on TV, print, radio, and billboards, do not appear in GA4.
Multiple touches. A consumer may see a product or brand offline, search for it on Google, click on a paid listing, and then abandon the journey. Later, the product may appear in the shopper’s Instagram feed, prompting the conversion. No attribution scenario can pinpoint the source(s), as it varies by shopper.
Repeat purchases. Some returning customers go directly to a website, while others respond to ads.
Despite the differences, Google Analytics remains the most-used attribution tool. It’s free, with an ecosystem of users, consultants, and resources. It’s a good choice for advertisers on Google-owned platforms, although it also captures referrals from other sources.
Other Methods
Still, merchants have other attribution options.
Ecommerce platforms. Shopify, for example, offers multiple attribution models — last click, last non-direct click, and first click — and multiple windows. Most platforms, including Shopify, show just one source per sale. Merchants with few marketing channels and single touchpoints can usually rely on their platform’s reporting.
Third-party tools. Segment, Adobe Analytics, and others utilize regression models for multi-touch attribution, similar to GA4’s Data-driven method of assigning a value to each source by channel or campaign. Third-party tools do the math but cost money. They are not as accurate as one would hope, in my experience.
Marketing platforms. Most marketing channels offer built-in reporting for performance tracking on that platform. Advertisers can monitor, for example, the creative, body text, and audience targeting. But in-platform reports are not ideal when contrasting, say, Google versus Meta.
Simplified approach. An easy-to-implement method is to compare daily sales from your ecommerce platform with GA4’s Data-Driven conversion attribution reports. Then assess GA4’s values to establish the source of truth. Apply over- or under-reporting in GA4 as a percentage to arrive at a return on investment per channel. Perhaps a TV ad or a brand campaign generated a sales boost. Neither would appear in GA4. While not exact, this simplified approach can provide a more accurate reflection of a channel’s impact on revenue.
Here’s an example. My firm just analyzed sales attributions for an ecommerce health food client. We found (i) a strong sales correlation with both Google Ads and email marketing, (ii) a moderate correlation with Instagram ads, and (iii) a weak to non-existent correlation with sales and TikTok Ads. However, we did see success with retargeting ads on TikTok.
No Perfect Model
I know of no perfect conversion attribution platform or technique. The purchase journeys of modern shoppers are too complex and varied. But we can consistently gauge the impact of a channel or campaign by establishing the right process for a merchant’s products, marketing tactics, and tech setup.
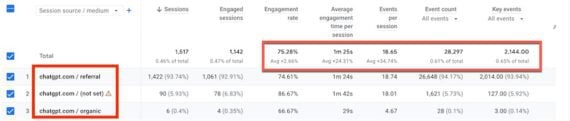
ChatGPT is becoming a valuable traffic source. It may not appear in a Google Analytics overview because the volume is small, but ChatGPT traffic is often the most engaging source, even more than organic search.
I base those observations on my experience optimizing client sites for AI answers.
ChatGPT traffic is often the most engaging, per Google Analytics. Click image to enlarge.
I know of no studies examining why ChatGPT traffic performs well, but I have two theories:
Like organic search, ChatGPT provides solutions to problems, with occasional links to external sites to learn more.
The trend may change as genAI tools become mainstream. Until then, monitoring AI traffic is essential.
Track ChatGPT Referrals
In Google Analytics 4:
Go to Acquisition > Traffic acquisition,
Below the graph in the drop-down, choose “Session source / Medium,”
In the “Search” field, type “gpt” and click “Enter” to filter session sources.
GA4, go to Acquisition > Traffic acquisition. Click image to enlarge.
Then create custom reports to access the data quickly.
Some external tools can filter GA4 data traffic. For example, Databox allows users to add the report to its dashboard and even overlay other data, such as conversions:
Databox allows users to add the GA4 report for ChatGPT. Click image to enlarge.
ChatGPT does not disclose actual user prompts, but we can surmise the content by exploring the landing pages of those users. Each page solves a problem. Thus the prompt presumably requested that solution.
Analyze ChatGPT Referrals
In GA4:
Go to Engagement > Landing Pages,
Click “Add filter” below “Landing page,”
Select “Session source / Medium,”
Select “Contains” and type “gpt”
Click “Apply”
Build a “gpt” traffic source filter in GA4. Click image to enlarge.
This will filter traffic sources to those containing “gpt” and sort the landing pages by the most clicks from ChatGPT.
The resulting report will help identify pages that ChatGPT cites to solve relevant problems. From there, query ChatGPT to see the context of those citations, as in:
This is my URL: [URL]. What prompts would trigger ChatGPT to cite the page as a solution?
In recent years, the digital marketing landscape has experienced significant shifts, particularly concerning user privacy and data tracking mechanisms.
This reversal has implications for data clean rooms, which were poised to become essential tools in a cookieless world.
However, the persistence of third-party cookies does not diminish the growing challenges associated with signal loss.
Users are increasingly encountering cookie consent pop-ups and more prominent privacy notices across websites and apps, which is reducing the availability of data for marketers.
This heightened user awareness and control over personal data necessitate reevaluating data collection and analysis strategies.
Data clean rooms remain vital in this context. They offer a privacy-compliant environment where multiple parties can collaborate on data without exposing personally identifiable information.
They also enable advertisers and publishers to perform advanced analytics on combined datasets, extracting valuable insights while adhering to privacy regulations.
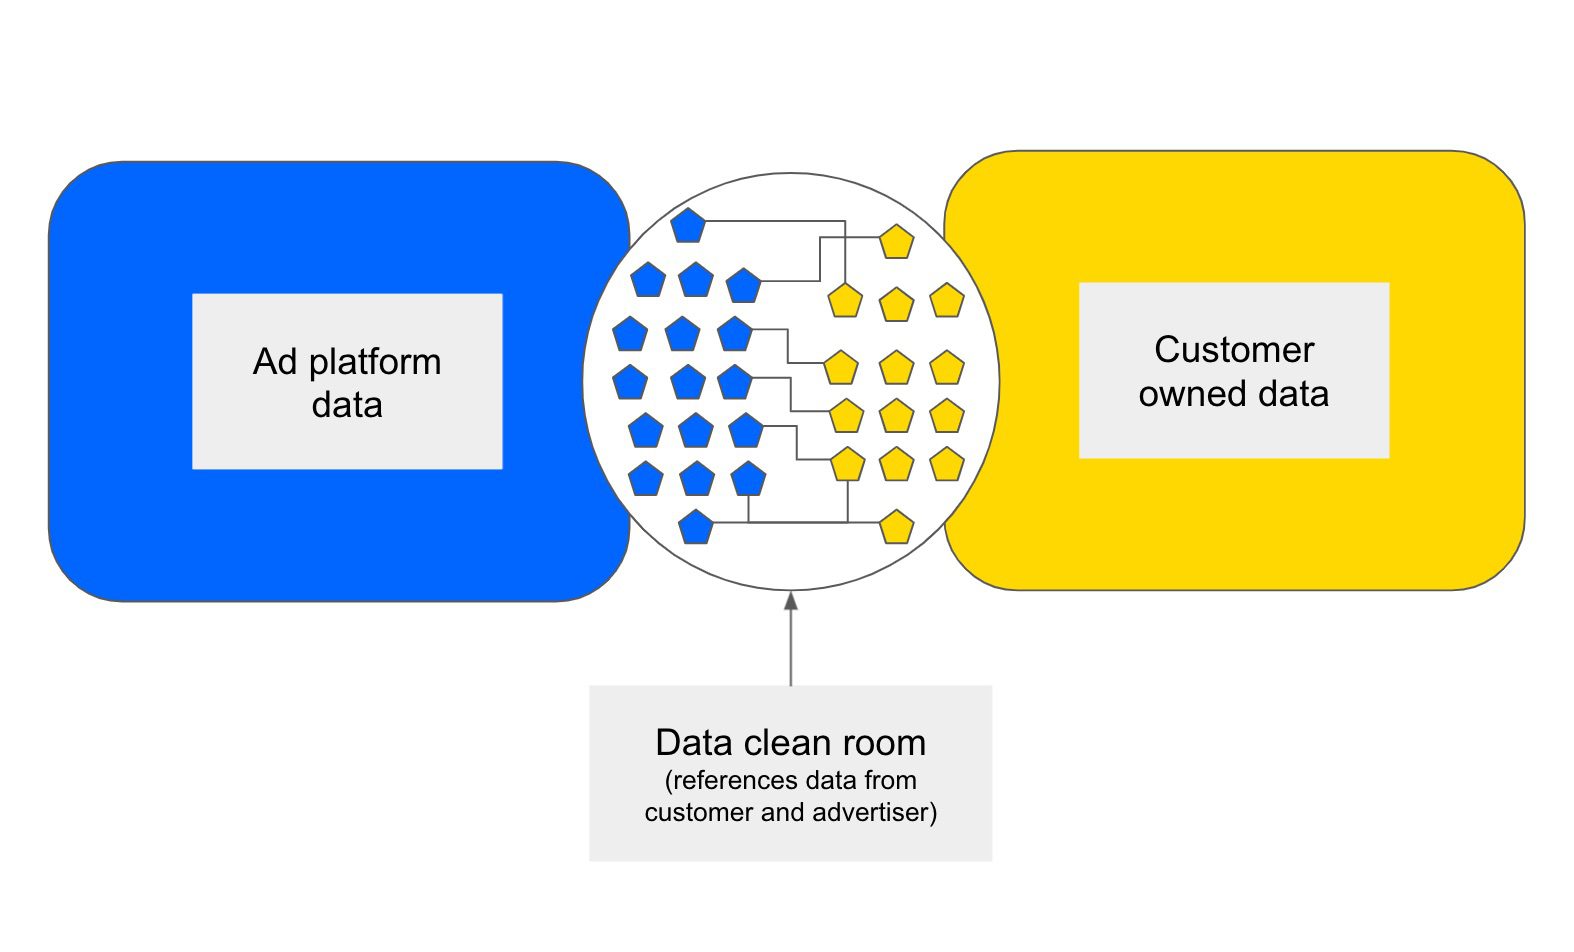
What Is A Data Clean Room?
A data clean room is a piece of software that enables advertisers and brands to match user-level data without actually sharing any PII/raw data with one another.
Major advertising platforms like Facebook, Amazon, and Google use data clean rooms to provide advertisers with matched data on the performance of their ads on their platforms.
Image from author, March 2025
All data clean rooms have extremely strict privacy controls, and businesses are not allowed to view or pull any customer-level data.
Modern data clean rooms have evolved to facilitate more streamlined and secure data collaboration.
They allow brands and publishers to combine datasets without exposing raw data, adhering to stringent privacy regulations.
This advancement addresses the challenges posed by increased data fragmentation and the heightened emphasis on user privacy.
The benefit to advertisers is a much clearer picture of advertising performance within each platform.
But, it does rely on a solid bank of first-party data in the first place in order to run any significant matching with platform data.
For example, Google’s Ads Data Hub allows you to analyze paid media performance and upload your own first-party data to Google. This allows you to segment your own audiences, analyze reach and frequency, and test different attribution models.
There’s one major issue with this approach.
Although many platforms claim to be able to offer a cross-channel clean room solution, it’s hard to see how this would be the case given the strict privacy controls in place by Google and other platforms.
This is fine if a brand wants to increase spend within each platform, but it still creates a challenge in cross-network attribution.
An Example: Google Ads Data Hub
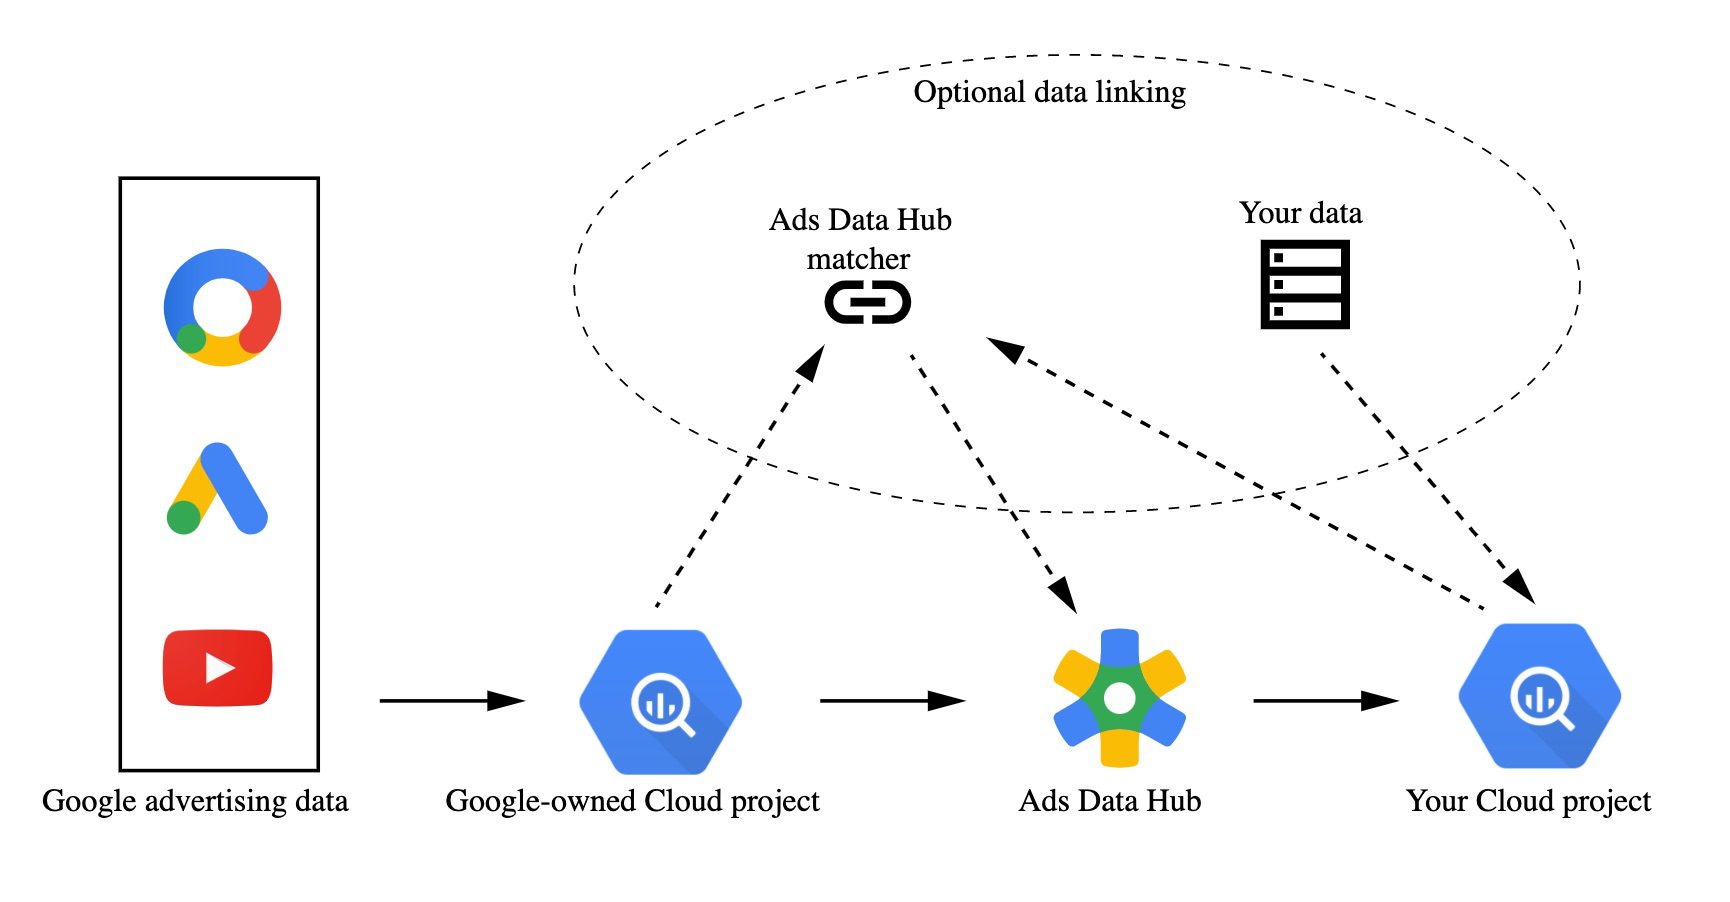
Google’s Ads Data Hub is expected to be a future-proof solution for Google-specific advertising (Search, Display, YouTube, Shopping) measurement, campaign insights, and audience activation.
Ads Data Hub is most effective when running multiple Google platforms, and if you have a substantial amount of first-party data to bring to the party (e.g., CRM data).
Screenshot from Ads Data Hub, Developers.google.com, March 2025
Ads Data Hub is essentially an API. It links two BigQuery projects – your own and Google’s.
The Google project stores log data you can’t get elsewhere because of GDPR rules.
The other project should store all of your marketing performance data (online and offline) from Google Analytics, CRM, or other offline sources.
Data Clean Room Challenges And Limitations
First-party data (the kind used to power data clean rooms) comes with fewer headaches around complying with privacy regulations and managing user consent.
But, first-party data is also much harder to get than third-party cookie data.
This means that the “walled gardens” such as Google, Facebook, and Amazon, which have access to the largest bank of customer data, will benefit from being able to provide advertisers with enhanced measurement solutions.
Also, brands that have access to lots of consumer data – e.g., direct-to-consumer brands – would gain a marketing advantage over brands that have no direct relationships with consumers.
Most data clean rooms today only work for a single platform (e.g., Google or Facebook) and cannot be combined with other data clean rooms.
If you advertise across multiple platforms, you will find this limiting since you cannot join the data to build a full view of the customer journey without manually stitching the insights together.
Before marketers dive into a specific clean room platform, the first consideration should be how much of your ad spend is focused on each network.
For example, if the majority of digital spend is focused on Facebook or other non-Google platforms, then it’s probably not worth investing in exploring Google Ads Data Hub.
Alternatives To Data Clean Rooms
Data clean rooms are just one way of overcoming the challenges we face with the loss of third-party cookies, but there are other solutions.
Two other notable alternatives being discussed right now are:
Essentially, this will hide users’ identities in large, anonymous groups, which many are skeptical about.
To be clear, FLoCs aren’t clean rooms – but they do anonymize user-level data and cluster audiences based on shared attributes.
Universal IDs
Universal user IDs are an alternative to the browser-based tracking option presented in Google’s privacy sandbox.
These would be used across all major ad platforms but anonymized so advertisers wouldn’t see a person’s email address or personal data.
In theory, universal IDs would make cross-network attribution easier for advertisers, as the universal ID tag would effectively replicate the functionality of third-party cookies.
What Will The Future Hold?
Tracking and reporting are no longer background tasks that we used to take for granted; they now require explicit user consent.
This transition requires companies to ask users for their consent to give up their data more often.
It requires users to click through more obtrusive privacy pop-ups. It will probably create more friction for users, at least in the short term, but this is the trade-off for a free and open web.
Beyond the “walled gardens” such as Google, some companies are working to build omnichannel data clean rooms.
These secure environments facilitate collaborative data analysis, enabling marketers to derive actionable insights without compromising user privacy.
In summary
Data clean rooms have become indispensable in navigating the complexities of modern digital marketing.
Their ability to enable secure, privacy-compliant data collaboration positions them as crucial tools in addressing the challenges of data fragmentation and stringent privacy regulations.
While this would certainly help with the challenge of cross-platform attribution, there will likely be a mismatch between the data provided between different ad platforms that will require manual interpretation.
Regardless of the “clean room” technology that will enable this data matching, there is a need to invest in building up your own first-party data now to enable any cross-referencing of data with advertising platforms or ad tech providers.
This requires creating and trading value for deep data on your customers.
We’ve all been there. You spend weeks optimizing content, fixing technical issues, and building quality links – only to have your client skim through your report and ask, “But how is this affecting our bottom line?”
And they’re right to ask. As experienced SEO managers, we need to move beyond traffic numbers and keyword rankings.
Your clients don’t care about impressions or even clicks if they can’t see how those metrics translate to actual business results.
I’ve learned this lesson the hard way. After losing a major client despite significantly improving their rankings (it turns out they weren’t ranking for terms that actually drove revenue), I completely revamped our reporting approach.
Now, I focus on connecting every SEO effort to business outcomes that my clients genuinely care about: revenue growth, reduced acquisition costs, and competitive advantages.
The truth is, with AI reshaping search and budgets under constant scrutiny, proving SEO’s business value isn’t optional anymore. It’s essential for keeping your clients and justifying your fees.
So, let’s talk about how to transform standard SEO reports into strategic assets that make your clients see you as indispensable.
1. Traffic: Beyond Volume To Value
Let’s be real: Your clients aren’t getting bonuses for traffic increases alone anymore.
Yes, traffic is still foundational, but your CMO clients are being hammered about return on investment (ROI) in every meeting.
They need ammunition to defend their budgets, and “we got more visitors” doesn’t cut it in the boardroom.
When I start client reports now, I immediately connect traffic to dollars.
Here’s how to transform this section from a traffic report to a value demonstration: First, ditch the habit of leading with “traffic went up X%.”
Instead, start with: “Organic search generated $X in revenue this quarter through Y new customers.” This immediately frames SEO as a revenue channel, not a vanity metrics game.
Here’s what your traffic section should include:
Traffic that matters: Break down traffic by buying intent. 10,000 visitors with purchase intent beats 100,000 tire-kickers every time. Show this segmentation.
Revenue story: What actual money did this traffic generate?
Comparison value: “This organic traffic would have cost $X through paid channels” is powerful. Use organic traffic value.
Mobile: Mobile now accounts for 64% of organic searches (up from 56% in 2021). If your mobile performance lags, you’re leaving money on the table. Highlight this gap!
Customer Journey Insights: Show where organic visitors enter the funnel and how they move through it. This tells a much richer story than pure traffic numbers.
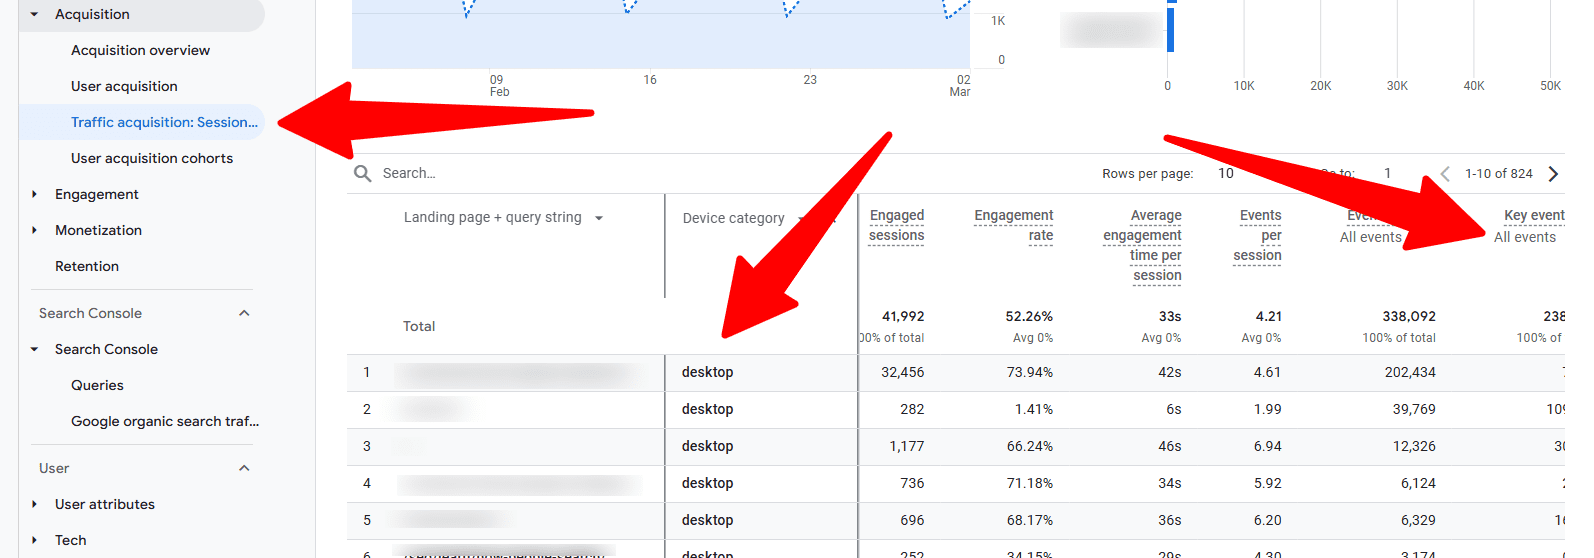
My favorite Google Analytics 4 report for this is: Go to Acquisition > Traffic Acquisition, then add a secondary dimension for “Landing Page” and “Device Category.”
Export this data, then merge it with your conversion values. Suddenly, you have a powerful view of which entry points and devices are actually generating business.
Screenshot from Google Analytics 4, March 2025
Example:
Old Way: “Organic traffic increased by 15% month-over-month.”
New Way: “Organic search delivered 42% of new customer acquisitions this quarter, generating $267,000 in attributed revenue. This traffic would have cost approximately $85,000 through paid search, that’s a 214% ROI on our organic search investment. Interestingly, mobile visitors from our how-to content are converting at twice the rate of desktop visitors, suggesting we should prioritize mobile experience for these high-value entry points.”
2. Conversion Impact & Business Goal Alignment
I once spent three months improving a client’s conversion rate from 2.7% to 3.4% and excitedly presented this in our quarterly meeting. The CMO’s response? “So what does that mean?”
That painful moment taught me something crucial: Conversion rates only matter when tied to business goals the C-suite actually cares about.
Your client’s executives don’t wake up thinking about conversion rates. They worry about acquisition costs, revenue targets, and competitive pressures. Your reports need to speak this language.
Here’s how to make your conversion metrics matter:
Start with their goals, not yours: Begin this section by restating the client’s specific business objectives: “Your Q1 goal was to reduce customer acquisition costs by 20% while maintaining volume. Here’s how our SEO work delivered on that…”
Cost comparison is king: I’ve found nothing gets more positive reactions than showing how much cheaper SEO-acquired customers are compared to paid channels. This is pure gold for CMOs defending budgets.
Lifetime value is your secret weapon: A friend at a major direct-to-customer (DTC) brand was about to have their SEO budget cut until they showed that organic search customers had a 31% higher lifetime value than social media acquisitions. Budget was not only saved, but also increased.
Multi-touch reality: Today, the attribution game has changed. Use GA4’s Advertising workspace > Conversion paths to show how organic search contributes throughout the journey, not just on last-click conversions.
Screenshot from Google Analytics 4, March 2025
Cross-channel impact: Show how SEO supports other channels. When I demonstrated to a client that organic content influenced 34% of their paid social conversions, their perspective on SEO completely changed.
Here’s my favorite method: Try to get access to your client’s customer relationship management (CRM) data (even a sample will do) and match it with GA4’s customer acquisition source data.
This lets you compare not just conversion rates but actual customer value by channel.
Example:
Old Way: “Conversion rate increased from 2.7% to 3.4% this quarter.”
New Way: “Our SEO program is now your most cost-efficient customer acquisition channel, with customer acquisition costs 27% lower than paid search and 42% lower than social. Even better, these organic search customers have a 22% higher lifetime value, adding an additional $142,000 to your annual customer base value. This directly supports your stated Q1 objective of improving customer acquisition efficiency while maintaining growth.”
3. Top Performing Content
I remember when top-performing pages just meant a list of URLs with the most traffic.
Content isn’t just content anymore; it’s a collection of strategic assets with different roles in your business.
Some content drives revenue directly; some builds trust; some answers key questions that remove purchase barriers. Your reporting needs to reflect this.
Here’s how to report on this to move from a simple traffic list to a strategic analysis:
Track content ROI by type: I’ve started categorizing content by purpose (consideration, conversion, retention) and tracking the ROI of each type. For one client, we found that their buying guides delivered five times the ROI of their how-to content, completely changing our content strategy.
Face the AI reality: With Google’s Search Generative Experience (SGE) and other AI systems affecting visibility, you need to show how your content performs in these environments. One trick: Track featured snippet capture rates alongside traditional rankings. For many queries, if you’re not in position zero, you’re invisible.
Map the customer journey: Don’t just report which pages get traffic; show how different content types move people through the funnel.
Quantify content gaps: When I find a competitor ranking for high-value terms we’re missing, I estimate the potential revenue based on search volume, our average conversion rates, and customer value. This turns content gaps from “maybe we should write about X” into “$125,000 annual revenue opportunities.”
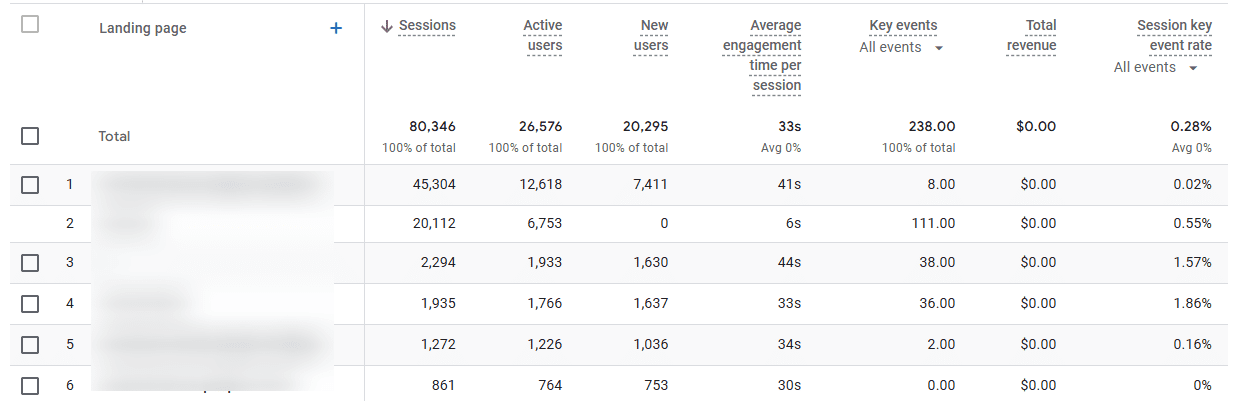
Here’s my favorite method: Export GA4 landing page data with key event metrics, then join it with GSC query data to see which types of search intent drive the most value.
This often reveals surprising insights about what content actually drives business results versus what just gets traffic.
Screenshot from Google Analytics 4, March 2025
Example:
Old Way: “Your blog posts about [topic] received the most traffic this quarter.”
New Way: “Your product comparison content delivers the highest ROI of all content investments at 382%, generating $93,500 in quarterly revenue while capturing 64% of available featured snippets in this category. Meanwhile, our analysis identified a strategic content gap in the [specific topic] area, representing a $125,000 annual revenue opportunity that your competitors are currently capitalizing on. I recommend we prioritize closing this gap in Q3.”
4. Technical Performance
I used to dread the technical SEO section of client reports.
Eyes would glaze over at the first mention of “crawl budget optimization” or “Core Web Vitals.” Then, I learned a simple trick: Translate everything into dollars and cents.
In most cases, clients don’t care about technical SEO. They care about making money and saving money. When you frame technical improvements in those terms, suddenly, everyone starts paying attention.
Here’s how to make technical SEO sexy (yes, it’s possible!):
Connect speed to money: Stop reporting PageSpeed scores in isolation. Instead, show the revenue impact. Show calculations that even minimal improvement in load time was worth $XXX based on their conversion rate lift. That will get their developer resources allocated quickly.
Quantify technical debt: I’ve started putting actual dollar values on technical issues based on their estimated impact on search performance and conversions. Instead of an issue “severity” score, I now show “revenue at risk,” and it completely changes the conversation.
Schema implementation as a revenue driver: For one retail client, adding product schema increased CTR by 16% and drove a 7% increase in product page traffic value. When presented in revenue terms, they immediately asked how quickly we could expand this to all category pages.
Mobile experience in dollars: With mobile now dominating search, any mobile experience gaps translate directly to lost revenue. Show the conversion rate difference between devices and calculate the revenue impact of closing that gap.
Here’s my favorite method: I also love using Screaming Frog’s crawl data, joined with analytics, to try to quantify the impact of technical issues.
Example:
Old Way: “Your mobile PageSpeed score improved from 72 to 92.”
New Way: “Our Core Web Vitals optimization closed the mobile conversion gap by 18%, delivering an estimated $56,000 in additional quarterly revenue. This means our technical optimization work has already paid for itself 2.8 times over in just 90 days. Based on this ROI, I recommend we allocate resources to implement similar optimizations on the category pages next, which could unlock an additional $87,000 in annual revenue.”
5. Competitive Intelligence
Nothing motivates clients more than beating their competitors. Trust me on this.
I’ve seen lukewarm reactions to impressive performance improvements suddenly turn enthusiastic when I frame the same data in competitive terms.
There’s something about “we’re taking market share from Company X” that gets executives excited in a way that pure metrics never will.
Here’s how to transform competitive reporting from basic rank tracking to strategic intelligence:
Think market share, not rankings: Track search visibility market share trends over time. This gives executives the big picture they care about.
SERP feature strategy: Feature ownership has become critical. I track which competitors dominate different SERP features and develop strategies to capture these high-visibility positions.
Topic authority positioning: Instead of thousands of keywords, I now organize reporting around key topic clusters and show authority positioning in each. This makes the competitive landscape much clearer and helps focus resources where they’ll have the biggest impact.
Opportunity mining: My favorite approach is identifying where competitors are slipping. When I spot a competitor losing visibility in a valuable category, I quantify the revenue opportunity based on search volume and our conversion benchmarks. This creates clear, compelling opportunities.
AI competitive intelligence: With AI reshaping search, I’ve added comparison metrics showing how often our content appears in AI-generated responses compared to competitors.
Tip: Don’t just track competitive metrics – turn them into opportunity estimates.
When I find a competitor’s weakness, I calculate the potential value using: [Search Volume] × [Estimated CTR] × [Average Conversion Rate] × [Average Order Value].
This transforms competitive insights into concrete business opportunities.
Example:
Old Way: “We’re now ranking higher than Competitor A for these 28 keywords.”
New Way: “Our search visibility market share has increased to 23% this quarter (+4% YoY) while Brand X has declined to 27% (-6% YoY), putting us on track to become the market leader by Q4. We’ve identified a significant opportunity in the [specific category] where Competitor B has unexpectedly lost 42% visibility. Based on search volume and our conversion benchmarks, this represents a $220,000 annual revenue opportunity we can capture with a targeted content and optimization strategy. “
6. AI Adaptation
AI is starting to disrupt our traditional world as SEO professionals. If you’re not talking about it in your reports, you’re doing your clients a disservice.
I remember the panic when SGE first rolled out, and clients started seeing their click data change.
Here’s how I will approach the AI section of reports:
Be honest about the zero-click reality: I start by acknowledging the elephant in the room. Yes, some traditional clicks are gone forever, but then, I pivot to what we’re doing about it.
AI visibility tracking: If you’re not already using AI visibility tracking tools, start now. I like what Knowatoa and Nightwatch are both doing.
7. Strategic Recommendations
This is where you earn your money.
Anyone can present data. The real value comes from translating that data into action and showing the likely business outcomes.
This section is your chance to prove you’re not just an SEO technician but a strategic business partner.
I learned this the hard way. I once delivered a report with 27 detailed recommendations without any prioritization or impact estimates.
The client’s response? “This is overwhelming. Where do we even start?” Now, my approach is different.
Here’s how to make your recommendations section actually valuable today:
Prioritize by ROI: No more than three to five key recommendations, ranked by projected return. I calculate the expected ROI for every suggestion and only present the highest-impact items.
Size each opportunity in dollars: Executives speak the language of money. I estimate the revenue potential for each recommendation based on historical performance data. This transforms “we should do X” into “this $30,000 investment could generate $120,000 in annual revenue.”
Get specific about resources: Vague recommendations get vague results. I specify exactly what resources are needed (developer hours, content creation time, etc.) and when. This prevents the “great idea, but we don’t have the resources” response.
Connect to competitive pressure: When appropriate, I frame recommendations as competitive responses: “Company X is gaining visibility in this category; here’s how we counter their strategy.” This creates urgency and executive interest.
Include AI strategies: With search changing, I now include specific recommendations for adapting to upcoming AI changes. This demonstrates foresight and positions you as strategic.
A Final Note: Demonstrating SEO’s Strategic Value
The most effective SEO reports tell a business story that clearly demonstrates how your SEO efforts drive meaningful business outcomes.
By connecting SEO metrics to revenue, customer acquisition, and competitive advantage, you position yourself as a strategic business partner rather than just a tactical service provider.
When creating your reports, remember that consistency in tracking methodologies is essential for showing progress over time, while flexibility to address emerging opportunities is equally important.
Establish a baseline reporting framework that evolves with the changing search landscape while maintaining core business metrics that executives care about.
By focusing on business impact rather than technical metrics alone, you elevate SEO from a channel tactic to a strategic business asset that drives value.
Aligning your team around the data points that drive the most impact.
When these pieces come together, you gain the clarity to track progress, scale insights, and make informed decisions with confidence.
But, how do you get there?
That’s where a marketing measurement plan comes in. This framework acts as a blueprint, outlining the critical components that keep your marketing data and analytics running smoothly.
It helps align stakeholders at every level – whether channel managers, developers, or leadership – so that everyone is working from the same playbook.
Most importantly, it keeps strategy and success metrics anchored to a common goal.
Let’s dive into the key elements and start building one for your business.
The Marketing Measurement Plan In A Nutshell
What Is It?
It is a map of individual inputs for accurate reporting that informs meaningful business insights.
What Does It Do?
It documents the business-critical measurements needed to track the results of a marketing plan and the high-level technical requirements that make it possible.
It doesn’t set benchmarks or goals. Rather, it’s the documentation of the “what” and “how.”
Why Is It Valuable?
1. It Clarifies Reporting Needs For Stakeholders Handling Implementation
Know exactly what’s needed to support the team because it’s all “right there.”
Ideally, stakeholders have played a role in mapping out the measurement model, so they’ll have no problem taking it from ideation to implementation.
2. Tracking Gaps Are Caught Before They Become Problems
There’s nothing quite as disheartening as getting to the end of a campaign and finding critical metrics missing from reporting.
The marketing measurement plan gathers inputs from – and is reviewed by – multiple stakeholders across the team. So, there’s less likelihood of discovering gaps down the road.
3. Creating A Marketing Measurement Plan Breaks Down Silos By Nature
It requires cross-channel and cross-functional input. Then, all of that input gets factored into prioritization at the highest level, documented in a language everyone can speak.
4. It Defines What Matters Most For Strategic Alignment
Is it more important to prioritize traffic or a specific conversion type based on business objectives?
You can see how even just that one important clarification makes a world of difference in strategy at the channel level.
For example, if the answer is conversion, SEO professionals would likely prioritize work specific to product pages over blog URLs in their roadmap.
5. It’s A Helpful Reference For Future Tracking Implementations
If and when new tracking is required, there’s a place to document any additions over time and ensure the tracking doesn’t already exist.
Plus, the implementation team can see everything else that’s already in place, so nothing gets broken in the process.
10 Questions Behind A Marketing Measurement Plan
A marketing measurement plan includes three distinct sections:
Technical Requirements.
Events & Audiences.
Implementation Requirements.
Tech Requirements
Cars can’t go anywhere without roads. Similarly, there needs to be a path for data to travel to the team. You need to map the key data sources, where they intersect, and where all of that data collects.
That’s a matter of answering a couple of questions, which will likely require input from the dev team.
What’s Our Front-End Tech Stack?
Implementing the analytics pipeline looks different depending on what your site uses to serve content.
In some cases, it’s actually multiple platforms, which means there’s additional work on each of them to get data into the same pool.
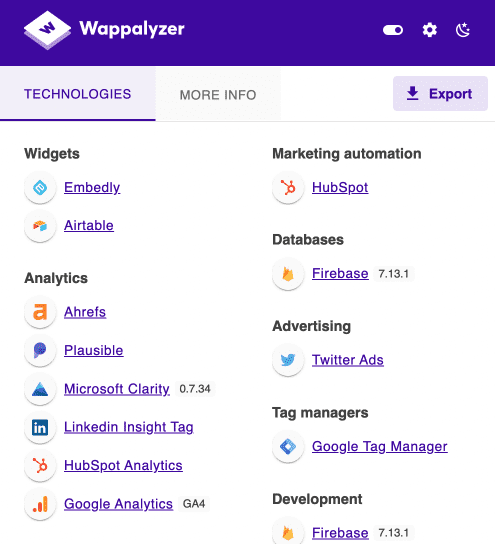
The Wappalyzer extension is an easy way to look under the hood and see the different platforms in play.
Just remember, it’s giving you information specific to the page rather than the whole site.
So, if you’re looking at a product page that’s served via Shopify, but the blog is built on WordPress, you wouldn’t catch that from the one page.
Screenshot from Wappalyzer extension for Chrome, February 2025
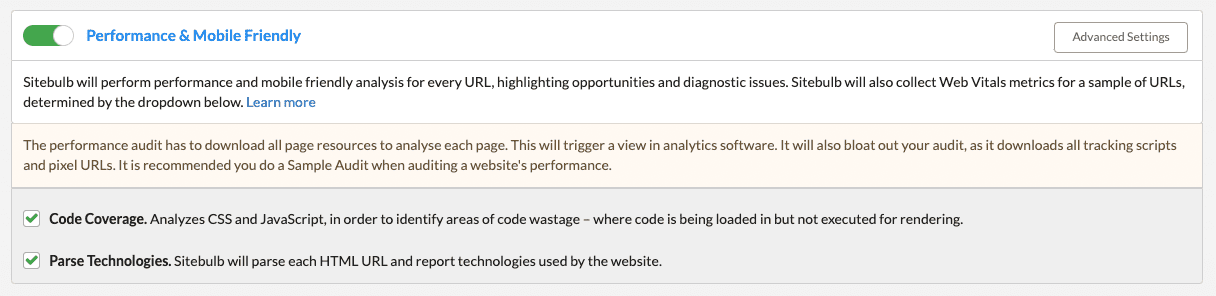
Alternatively, if you have access to Sitebulb, you can crawl the site with the Parse Technologies setting enabled.
This will give you a list of technologies used across the site, rather than just testing one page.
Screenshot from Sitebulb Performance & Mobile Friendly Crawler Settings, February 2025
When it comes down to it, the best route is to sync with developers, who’ll be able to break down the purpose of each platform.
You’ll want to make sure that the measurement plan includes:
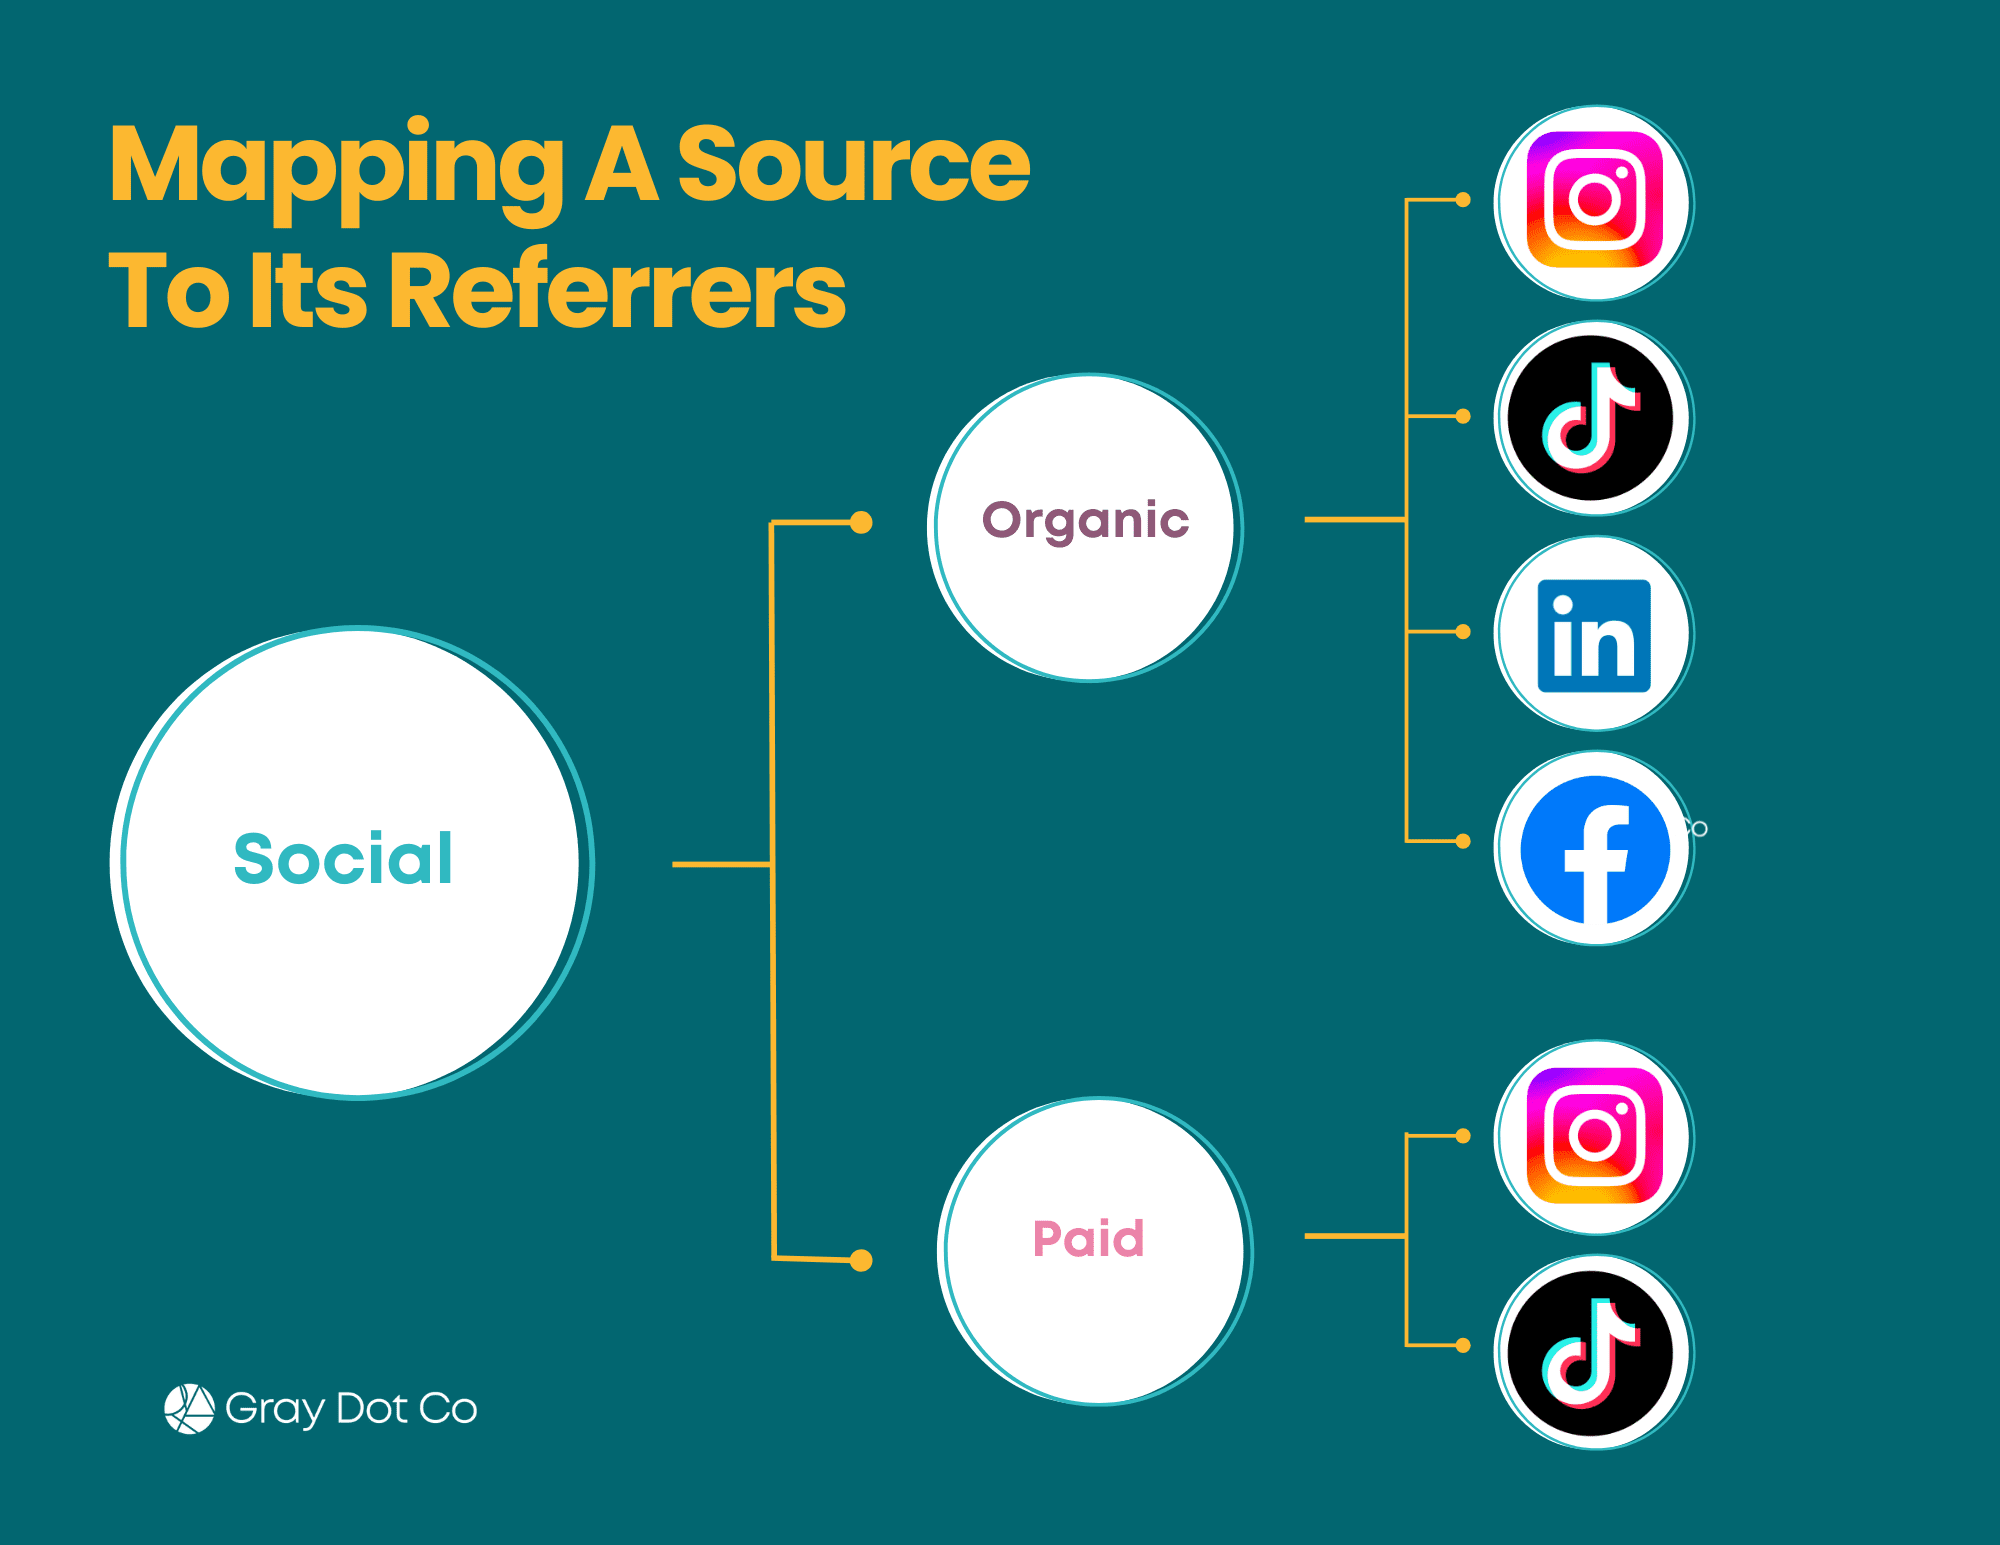
Traffic comes from many places: email, organic search, PPC ads, affiliate articles, etc. The traffic behaves differently based on the source because each source plays a slightly different role in the marketing strategy.
Additionally, each source is made up of different referrers, but not all of those referrers will matter to every business.
For example, a B2B SaaS company probably cares more about LinkedIn than Instagram, whereas the opposite is likely true for an ecommerce brand.
Both sources and referrers need to be mapped for implementation to ensure the audiences are available in reporting.
Mapping source to referrers using social media as an example (Image from author, February 2025)
The measurement plan should include the following:
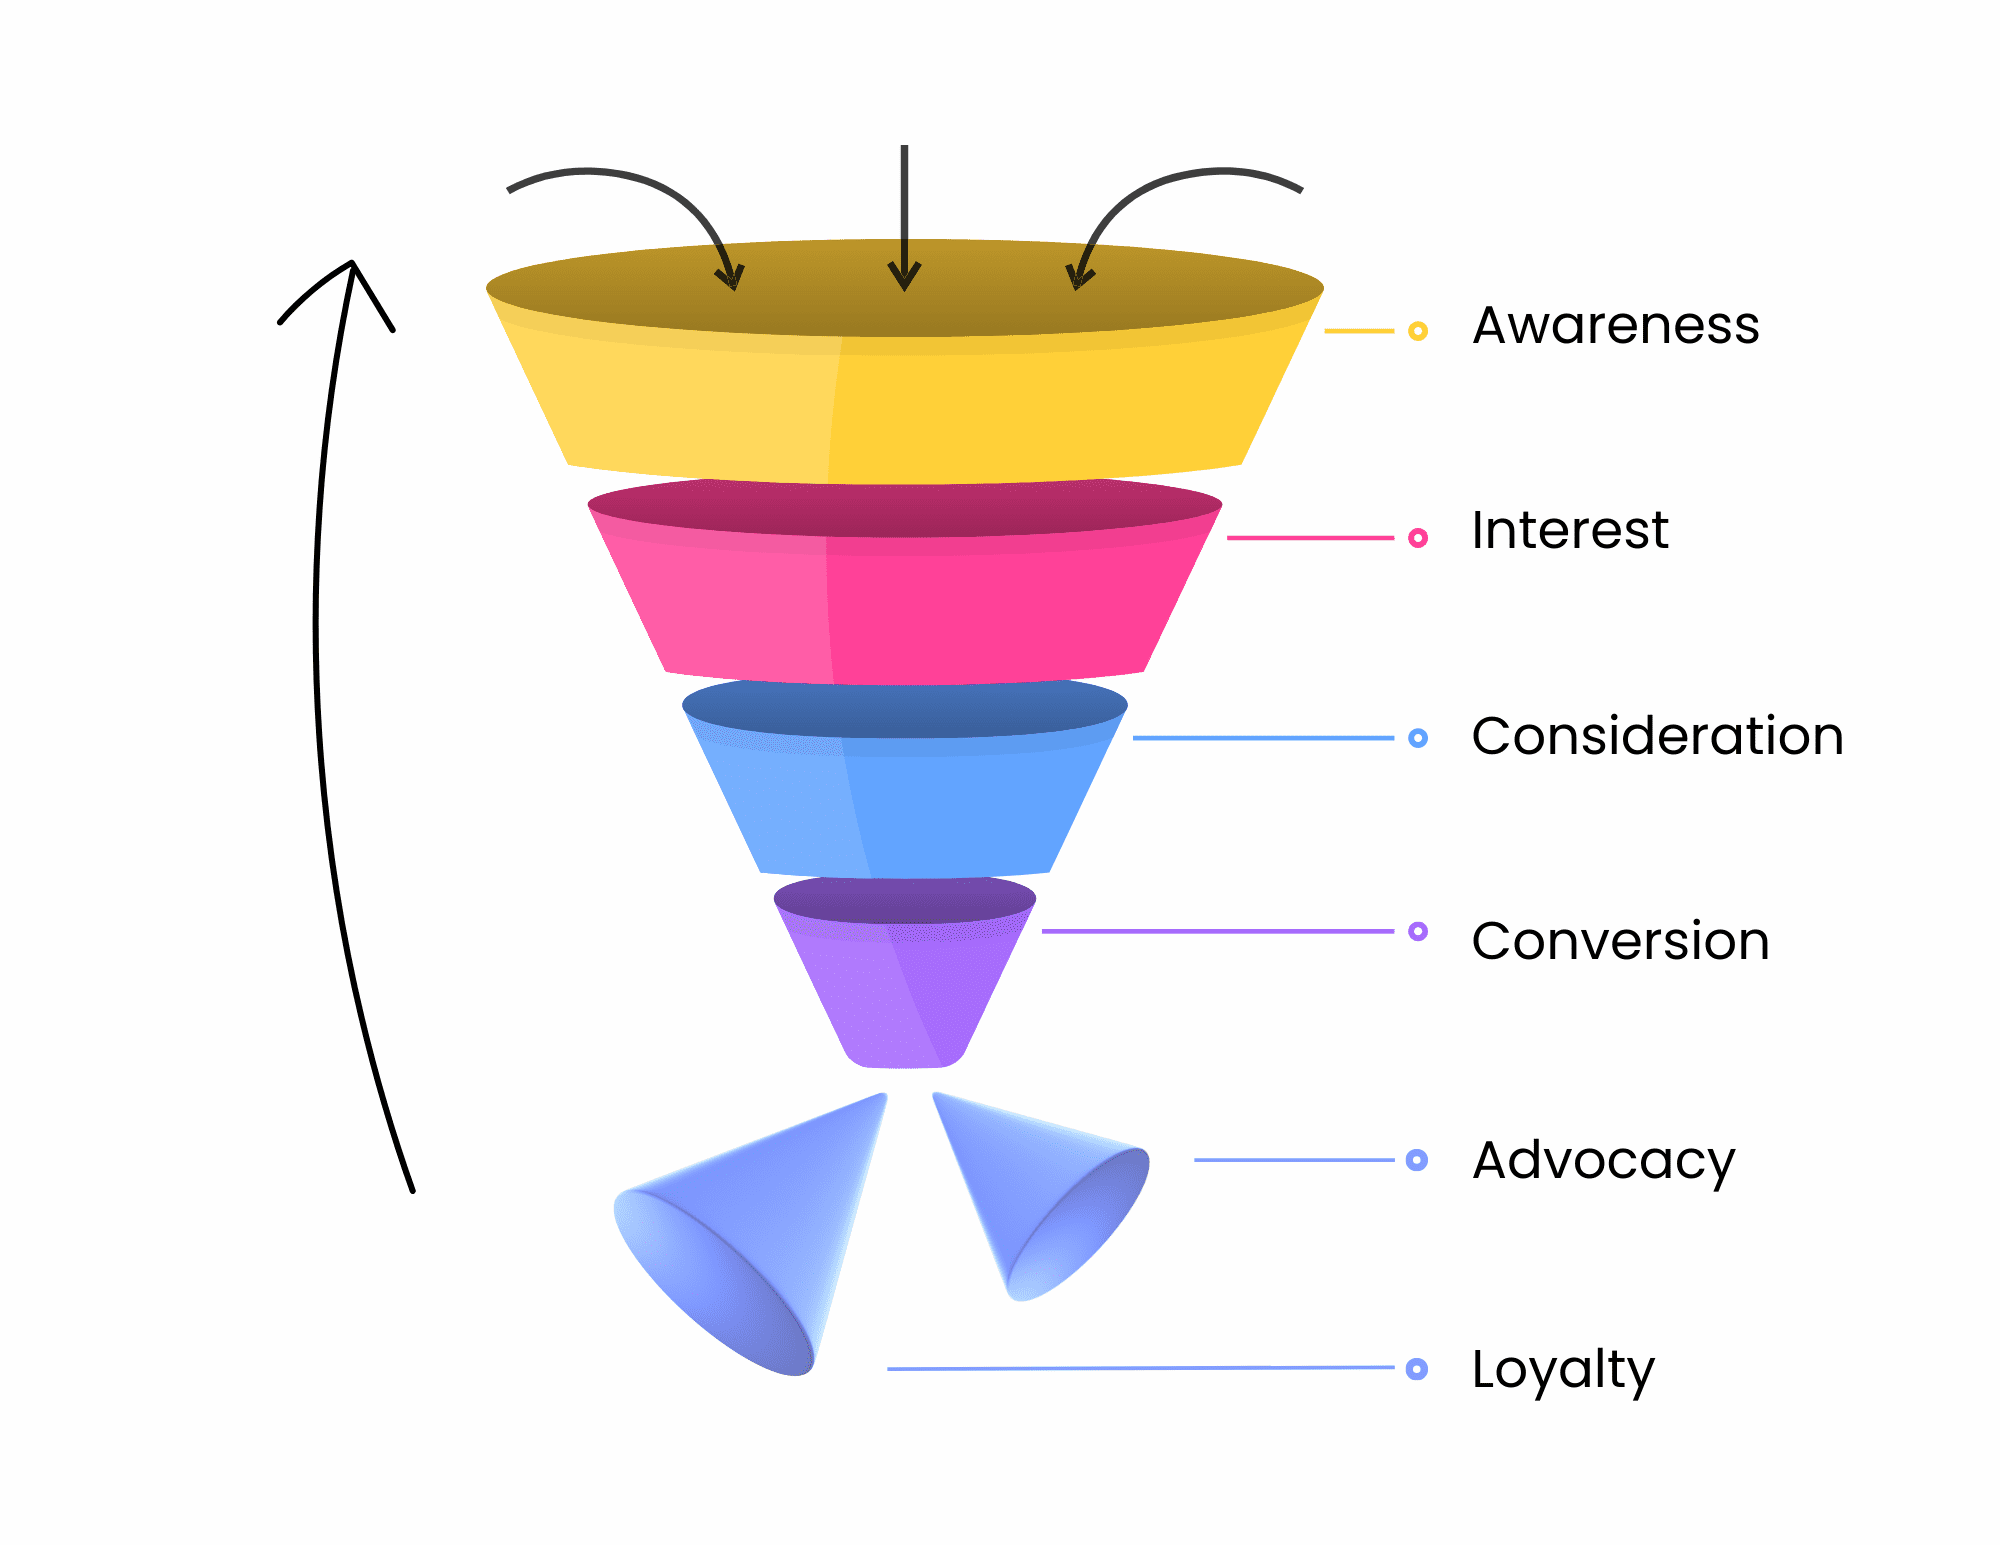
Which users are most likely to convert? Which behaviors show that users are moving closer to converting? Which promotions are most effective for which types of users?
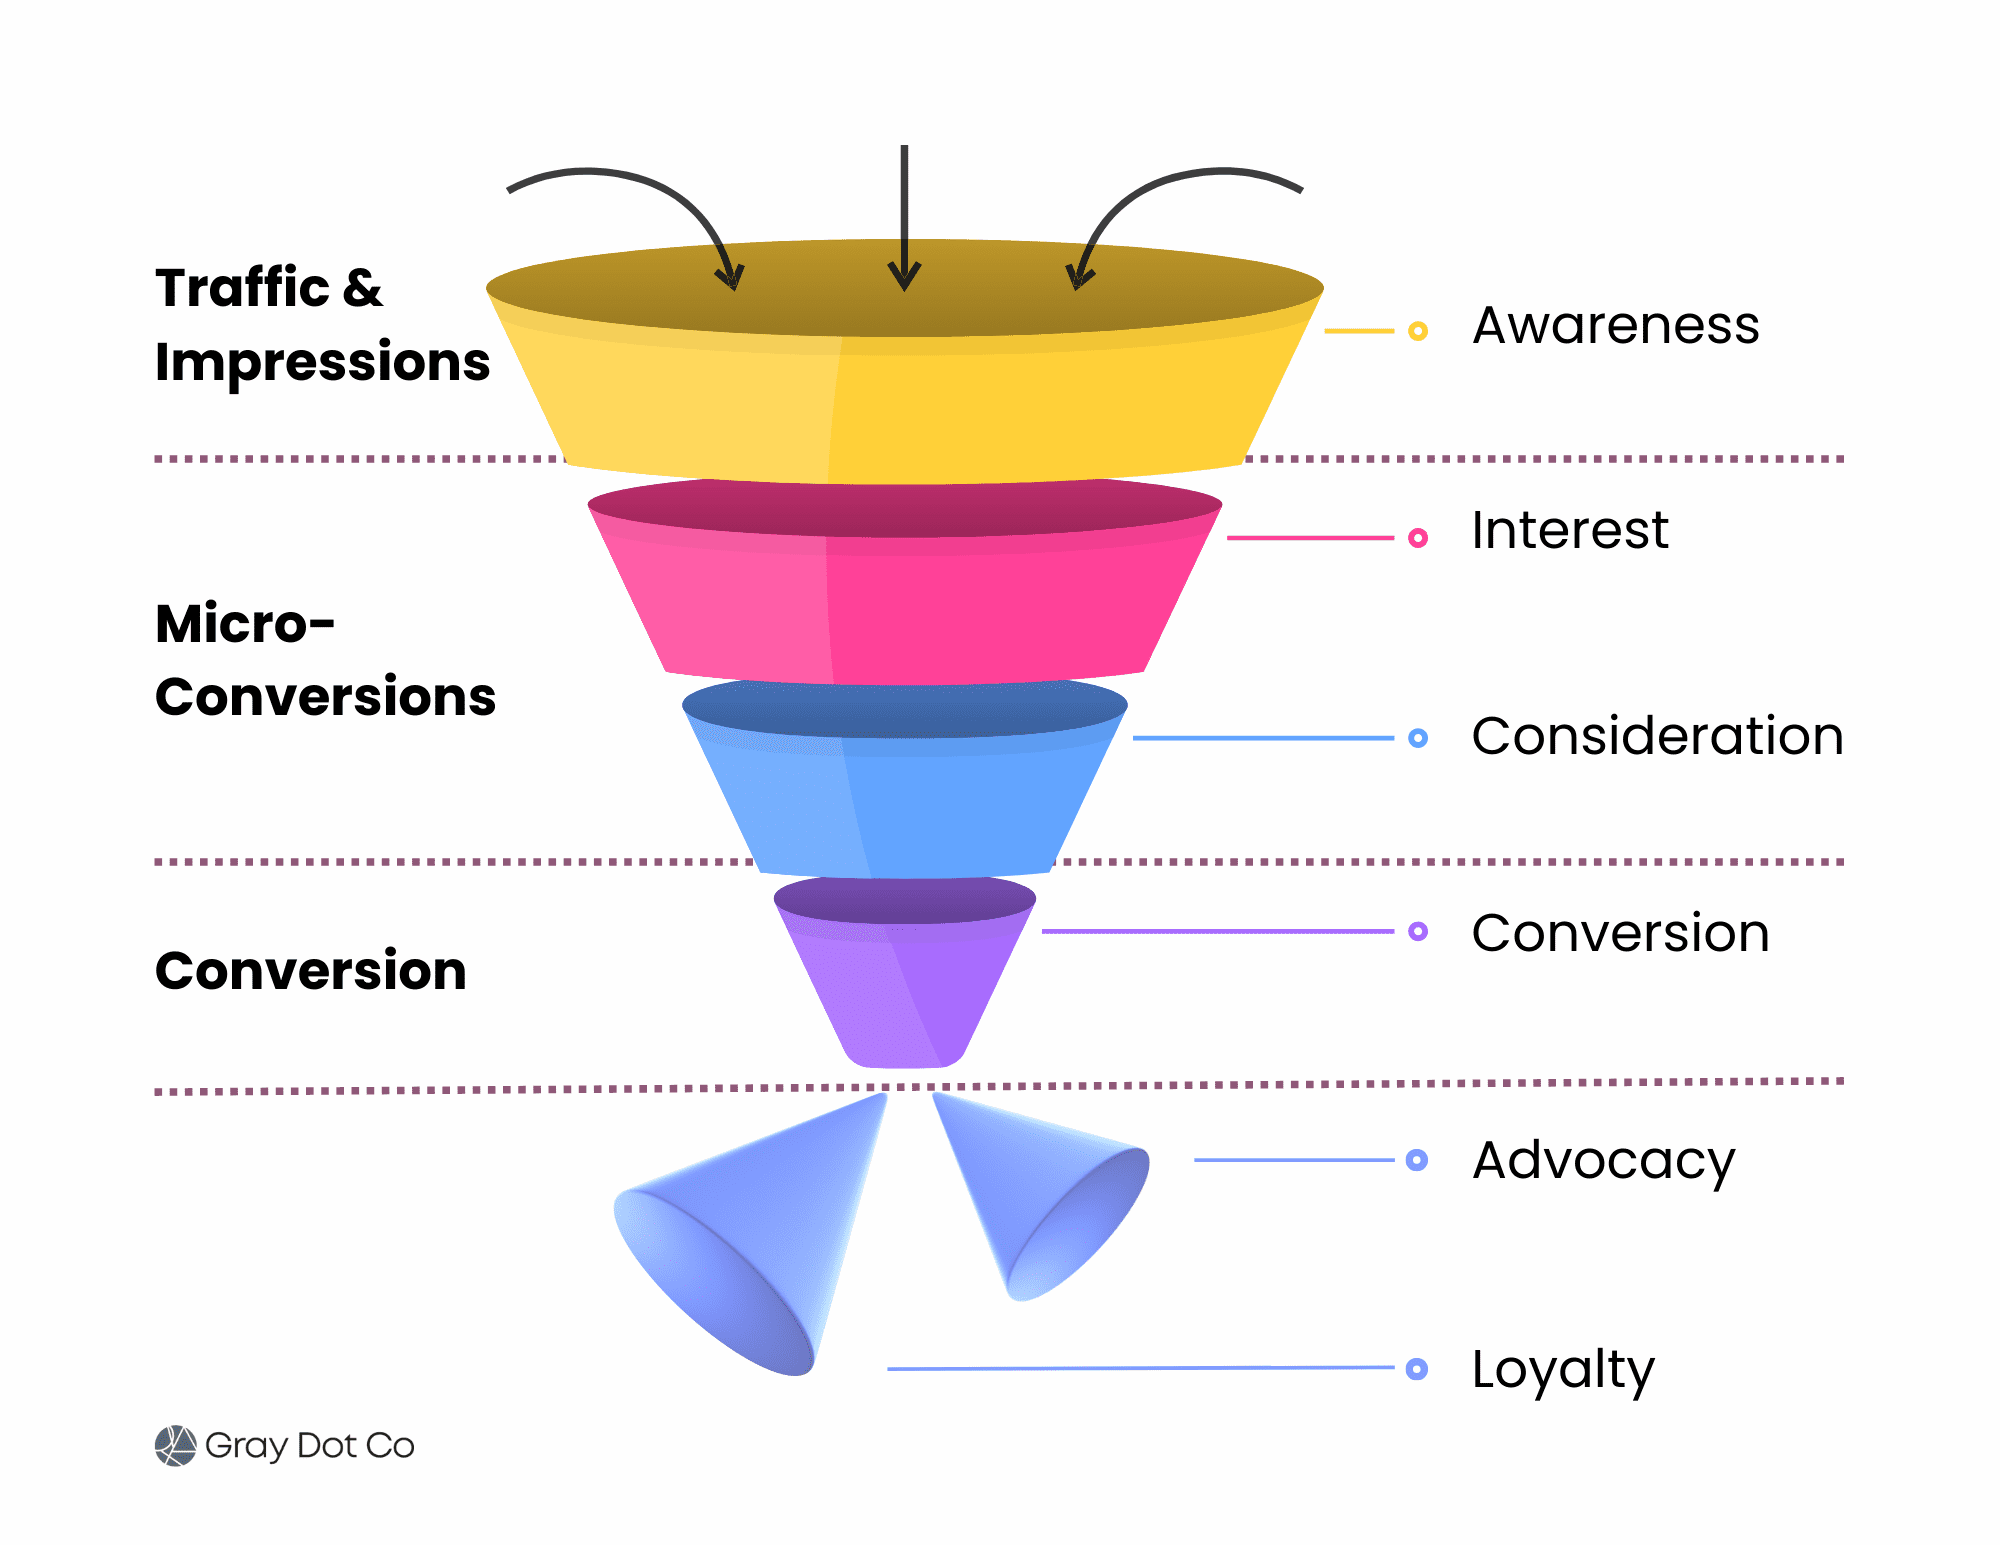
We can answer these questions by mapping behavior to the marketing funnel, allowing us to understand where different actions fit within the customer journey.
In turn, this helps marketers make the right “ask” of users at the right moment.
A visualization of the marketing funnel (Image from author, February 2025)
For example, users coming from a link in an affiliate article are probably less ready to purchase than users who click through an email CTA.
But, they could be willing to exchange their email address for a discount or resource, which would lead them into email, where users are more likely to convert.
To validate that assumption or extract insights, we need the right data. But first, we need to define what the right data is by identifying meaningful behaviors worth tracking.
What’s The Primary Action We Want The User To Take?
Every business has a desired end-point to the digital marketing funnel, a.k.a. a conversion.
The user action considered a conversion differs based on the objectives of the business.
A blog site will want users to subscribe, whereas an ecommerce company will hope to drive a purchase, and B2B SaaS marketing aims to drive qualified leads for the sales team.
The measurement plan should identify the user behavior that represents a conversion, which could include:
Transaction.
Request demo.
Subscription.
Start a free trial.
What Do Users Do As They Move Down The Funnel?
No one has a 100% conversion rate. The customer journey is made of multiple touchpoints and is not always linear.
To understand those touchpoints, marketers need to define the “micro-conversions” on the path to conversion, i.e., identify the smaller behaviors that users who convert exhibit along the way, and how close those actions are to a conversion versus one another.
Visualizing where micro-conversions fit in the marketing funnel (Image from author, February 2025)
The next section in your marketing plan should list micro-conversions within your customer funnel, including but not limited to:
Add a product to cart.
Sign up for email.
Share onsite content.
Download a sales or solution sheet.
Initiate a chat.
Engage with specific content (ratings/reviews, FAQs, etc.).
The problem with that: Just because a user didn’t bounce, it doesn’t mean they’re engaged per se. Couple that with the increase in the use of cookie banners, and you can see why it’s not the most telling metric.
For example, users who toggle product configurations on the product page might be more likely to convert than those who simply visit a product page. But, if that micro-conversion isn’t tracked, that insight would go by the wayside.
The measurement plan documents custom engagements (of which there can be many), including any relevant items from this list of common events:
Start a form.
Toggle product configurations.
View product images in carousel.
Log into account.
View a video.
Which Patterns Can We Use To Identify Valuable Groups Of Users?
Within the audience of people who visit your site, different segments will share different behaviors.
Some will be more valuable from a conversion standpoint, or may need unique pathing down the funnel.
To identify those segments and tailor marketing to their needs, we first have to map audiences to specific behaviors.
GA4 has some basic segments built in, such as audience by traffic source. However, creating your own audiences lends itself to more telling insights.
You can group users based on any number of conditions working together, allowing you to narrow the scope further.
In your measurement plan, focus on combinations of behavior that lend themselves to a deeper level of understanding. Here are some examples:
Group purchasers by the number of site visits before purchase.
Group engaged users by first session source.
Group users by intent based on landing-page category.
Implementation Requirements
We’ve gathered information about how our site works and what we want to measure. Now, it’s time to lay out the details of implementing analytics and reporting functionality.
This final section of the measurement plan covers requirements like the platforms to use and the specific parameters that make it possible to track events.
With that said, it’s generally a good section for the data/analytics team to own.
Which Analytics Platforms Should We Use?
Collecting data is one thing. For that data to be useful for marketing & analytics stakeholders, they need to be able to access, manage, and share it.
Otherwise, they can’t dig in for insights or report performance to the team.
That’s where the analytics solution comes in. The most well-known is GA4, though alternative platforms like Heap and Matomo are also available.
Then, another layer down are complementary tools for more specific types of data, including tools for A/B testing, heat mapping, etc. They generally depend on the API of the primary analytics solution.
In the measurement plan, make sure to document:
The primary analytics solution (GA4, Heap, Matomo, etc.).
How Will We Create Dashboards For Other Stakeholders?
A business can’t expect every team member who benefits from reporting to run their own reports. Plus, that would get expensive quickly! Shared dashboards are essential for keeping everyone informed and streamlining the process.
A data visualization tool like Looker Studio lets marketing and analytics stakeholders create self-updating reporting with the most relevant measurements.
Add the following to your measurement plan: Dashboarding tools (Google Data Studio, Microsoft Power BI, etc.)
What’s Our Tag Management System?
The answer to this question is most commonly Google Tag Manager, but it’s still worth taking a moment to unpack tags at a high level. Plus, it’s worth noting that there are some alternatives to Google Tag Manager.
Tags are the code and fragments that make measurement possible. Using a tag manager, analysts can easily create tags and define trigger events.
Tags, triggers, and variables make up a container, which is usually implemented in collaboration with the dev team.
While a tag manager is optional, it’s extremely valuable for the safe, swift deployment of analytics changes and updates.
So, one more item for your document: Tag management system
How Do We Enable Custom Events?
We chatted about custom events earlier. Now, we need to map out the parameters that make it possible to capture those events in the analytics solution.
While GA4 has some default events available upon implementation, Heap and Matomo require “data chefs” to cook from scratch.
Either way, a business will inevitably have unique reporting needs that require customization, regardless of which analytics solution it uses.
Custom measures are set up in the tag manager and might require some configuration to get the right data output. That looks different from platform to platform.
List custom event parameters tailored to the specific requirements of the analytics solution, based on the documentation below:
Accurate Data + Strategic Alignment = Growth
A marketing measurement plan isn’t just a map for creating an analytics proficiency; it’s also a tool that can help make existing analytics more proficient.
In either case, it’s an opportunity to create alignment around what really matters and accurate reporting that works hard for everyone.
It’s time to create one for your business, following the steps above, with help from the right stakeholders.
Special thanks to Sam Torres, chief digital officer at Gray Dot Company and speaker at BrightonSEO, for her extensive contribution to this article. Her deep expertise in data strategy and digital marketing ensures the accuracy and relevance of the insights shared here.
As SEO professionals, we’re data-driven. So, it’s ironic that we need to ask a counterintuitive question: “Where are the missing bullet holes in Google Analytics 4 (GA4)?”
Most of us trust the event-based data that GA4 collects. But we should use other tools and techniques to independently verify our analysis and interpretation of this data.
Why?
I just looked at data in the GA4 demo account of the Google Merchandise Store, and 46,811 of the 68,976 total users over the last 28 days were acquired from the direct channel.
This means 67.9% of users arrived at the site “via a saved link or by entering your URL.”
Screenshot from Google Analytics, January 2025
If you think the Google Merchandise Store’s data is an anomaly because it’s from the GA4 demo account, then check your own data.
I did, and 57.6% of my total users arrived through the direct channel. So, your mileage may vary, but there are probably more users than you can shake a stick at.
More importantly, the Google Merchandise Store’s business goal is to sell a variety of Google merchandise, including apparel, accessories, lifestyle products, stationery, and collectibles.
How would you analyze and interpret GA4’s data to determine which marketing efforts were effective?
You would analyze and interpret customer engagement data from the middle and lower parts of the so-called sales funnel.
If I were the owner of a brick-and-mortar store, I’d realize that I’m focusing all my attention on which aisles people walk down and which items they bring to the cash register.
But I still don’t have a clue where they heard about my shop before they walked through the door.
In other words, GA4 gives us less than a third of the data we need to know about user acquisition: The initial stage of building business awareness and acquiring user interest.
Somehow, we’ve missed what GA4 can’t – or doesn’t – tell us about the Zero Moment of Truth (ZMOT): the moment in the purchase process when the consumer or business buyer researches a product or service prior to visiting your website.
The Missing Bullet Holes
Why haven’t we spotted this misalignment before? Well, let me share a story.
My father was a sergeant in the United States Army Air Corps (USAAC) during World War II.
When I started conducting market research in the mid-1980s – when he was the director of marketing at Oldsmobile, and I was the director of corporate communications at Lotus Development Corporation – he told me a story that has since been retold in “Abraham Wald and the Missing Bullet Holes,” which is an excerpt from How Not To Be Wrong by Jordan Ellenberg.
During World War II, officers in the USAAC asked Abraham Wald, one of the smartest statisticians in the Statistical Research Group (SRG), to analyze some classified data.
When American bombers came back from missions over Europe, they were covered in bullet holes.
“But the damage wasn’t uniformly distributed across the aircraft,” Ellenberg notes. “There were more bullet holes in the fuselage, not so many in the engines.”
Wald recognized that the planes that came back were not a random sample of all the planes that had been sent on bombing missions, and he also realized the damage should have been spread equally among all the bombers.
So, he asked, “Where are the missing holes?” Ellenberg explains, “The reason planes were coming back with fewer hits to the engine is that planes that got hit in the engine weren’t coming back.”
The Missing Holes In User Acquisition
Digital marketers are in an analogous situation. GA4 provides us with so much event-based data that we’ve failed to spot the missing holes in user acquisition.
So, now that we realize that we don’t have a clue about where the lion’s share of our audience discovered our brand or product before visiting our website, what should we do?
We should conduct some audience research that can tell us:
Who are they? (Demographics: age, gender, location, job, and income).
What do they do? (Behavior: how they shop, what they search for online).
Where do they hang out? (Platforms: social media, websites, communities).
What matters to them? (Needs and Interests: their problems, desires, and what they talk about).
Are there any audience research tools that can help us? Yes, they include:
SparkToro or Audiense: For demographic and platform data.
Brandwatch, HootSuite, or Sprout Social: For social listening.
Ahrefs, Moz, or SpyFu: For keyword research.
Google Trends or Exploding Topics: For detecting internet search trends.
How Do You Spot The Missing Holes?
If you’re in the initial stage of building business awareness and acquiring user interest in other countries, then how do you spot the missing holes?
For over 10 years, I used the now sunset Google Surveys to answer questions like that. You can still use Google Forms or SurveyMonkey.
I asked survey expert and CEO of Growth Survey Systems Nathaniel Laban if he would provide a sample question for such a survey, and here’s what he sent me via email:
For a consumer or B2B study, it might look like this:
1. Where do you get news and information about (brand/product)? (Select all that apply. Multiple response.)
From friends, family, and colleagues.
From an expert or enthusiast who demonstrably knows the topic well.
Organic search.
Blogs, news sites.
Paid search.
Email.
Organic social.
Organic shopping.
Organic video.
Other (Specify):
Laban added:
“Communications and marketing channels should always be investigated for one’s target audience.
You need to meet people where they are today to be successful in communications and marketing campaigns. Test your assumptions about where your audience is and back it up with statistically representative data.
Trust your math, not your gut!”
What Can You Expect To Discover?
Now that you know how to spot the holes at the top of the funnel where GA4 can’t – or doesn’t – tell us what we need to know about ZMOT, what can you expect to discover?
GA4 provides a way to measure engaged-view key events, which indicate that someone watched a YouTube video for at least 10 seconds and then triggered a key event on your website or app within three days of viewing the video.
Engaged-view key events are a more accurate way to measure the performance of your video ads. They recognize the fact that users often don’t act immediately after seeing an ad, but rather after they’ve finished watching a video.
This also explains why 70% of YouTube viewers say they’ve purchased a brand after discovering it on the platform. It indicates that YouTube is a highly effective medium for brand discovery and purchase intent.
But to measure engaged-view key events, you need to link your Google Ads account to allow data to flow between Ads and GA4.
Unfortunately, there isn’t a similar way to measure engaged-view key events for other default channels in GA4 like organic video (e.g., YouTube or TikTok), organic social (e.g., Facebook or LinkedIn), or referral (e.g., blogs or news sites).
Users actively seek information about products and services by watching or reading this content, often leading to buying decisions based on what they’ve seen and learned in these channels.
But if you conduct an information sources survey and invest in the right channels and sources of influence, then you shouldn’t be shocked to find that you tend to generate more traffic, leads, and sales, too.
Conducting Brand Lift Surveys
What if your company or clients are in the automotive, consumer packaged goods, or retail industries, and your business objective is to raise brand awareness? How do you measure that?
Either periodically or before and after major campaigns, you can survey your audience and ask:
Standard Brand Awareness: Have you heard of (brand/product/message)?
Unaided Brand Awareness: Which of the following (brand/product category) have you heard of? (Tick all that apply.)
Top-of-Mind Awareness: Which of the following (brand/products) comes to mind first when you think of (statement)?
Standard Favorability: What’s your opinion of (brand/product)?
Familiarity: How familiar are you with (brand/product name)?
Intent: Will you buy (brand) the next time you shop for (category)?
Action Intent: How likely are you to purchase (brand)?
Recommendation: Will you recommend (brand/product) to a friend?
Consideration: How likely are you to (consider) (brand/product) the next time you want to (shop for) (category)?
Preference: Among the following (brands), which do you prefer most?
In other words, old-school market research can measure Brand Lift, which GA4’s event-based data can’t – even if it’s supplemented with audience research data.
The Lesson We Can Learn From The Missing Bullet Holes
Digital marketers who don’t conduct market research may know what users do when they reach the middle and lower funnel, but they haven’t a clue about why users in the upper funnel aren’t aware of their brand yet or where they can reach them.
That’s the lesson we can learn from “Abraham Wald and the Missing Bullet Holes.” It’s a lesson that my father learned more than 80 years ago, and he shared it with me about 40 years later. Now, I’m sharing it with you.
In short, trust GA4’s data, but verify your analysis and interpretation of it.
Marketers work with search data every day, but we’re greatly underutilizing its potential.
Let me explain.
Search data can tell us all kinds of things about markets, audiences, behavior, and preferences. It’s a source of intelligence that informs smarter, better, more timely business decisions beyond SEO.
In this article, I’ll introduce you to a different way of looking at “search data.”
We’ll talk about sources, which data to pull, and how to use it to arrive at powerful insights quickly.
What Is Search Data?
Search data is any data collected when a user searches a public website by entering a query string to find relevant information (products, information, or answers) from a library of different content (website pages, media) published from different sources (websites, creators).
When people conduct this type of search, they take direct action driven by a need. Put more simply, search data is “active demand.”
Looking at search behavior at scale unlocks a new way of gauging demand for whole industries, specific verticals, unique topics, individual brands, and beyond. This process is known as digital market intelligence.
What Is Digital Market Intelligence?
Digital market intelligence collects and analyzes thousands to (sometimes) millions of digital data points – from public, ethically sourced data – to get to the kind of insights that would traditionally require qualitative surveying.
Except that it’s a lot faster than surveying, and often, it’s more accurate because:
The data reflects real behavior from real people who are free from survey bias or influence.
It collects vast data sets in mere days (versus weeks or even months), ensuring timeliness and relevance.
Data sets contain significantly more data representing huge swaths of the population (versus a small survey sample).
Image from Gray Dot Co, October 2024
Search data is one of the primary inputs in digital market intelligence because it provides an abundance of real user behavior data at an extremely low cost.
Note: DMI is most effective when looking at established industries with a meaningful digital footprint – it doesn’t work for everything!
Where Do We Get The Data?
When most of us think of “search data,” we think of Google data. And make no mistake, that’s a huge piece of the puzzle. Google is still a giant in the search game!
But we’re also stepping out of the silo and acknowledging that sources like YouTube, Pinterest, TikTok, etc. are sources where users exhibit active demand.
The datasets from each are extremely valuable for digital market intelligence because we can tap into them at a marginal cost via APIs, platform-specific reporting tools, and third-party tools.
(For a lot cheaper than traditional consumer insights work!)
Google Search Console.
Google Ads.
Youtube API.
Google Trends.
Third-party tools like Semrush or Ahrefs.
Pinterest.
TikTok.
Image from Gray Dot Co, October 2024
Which Search Data Is Meaningful?
Now that we’ve established where we’re actually sourcing the data, what are we pulling?
Metrics we work with day in and day out are the raw inputs for calculations that answer big business questions:
Image from Gray Dot Co, October 2024
Keyword volume quantifies how often people actively look for products, information, or brands at any given time.
Hashtag volume measures how much of the content landscape is saturated by a given topic or brand.
Keyword intent identifies where people are in the customer journey, plus common behavior and language at different funnel stages.
Competitor research compares demand for brands apples-to-apples, plus how much demand each captures in the landscape.
Historical trends create a clear snapshot of shifts in demand to illustrate the trendline for any topic area over time.
What Can Search Data Tell Us About The Market?
Digital market intelligence can answer a lot of the questions marketing teams and even business leaders run into regularly.
Let’s take a look at some of the most common and illustrate how DMI can yield quick insights using search data.
Did The Market Grow Or Shrink YoY?
This is basically an exercise in summing active demand for the search terms that apply to your business or industry.
In a classic consumer insights sense, the size of the market is generally referred to as the Total Addressable Market.
To quantify TAM using search data, calculate the total keyword volume for the year across relevant search terms. You can source and export keyword volume at scale by using a third-party tool such as Semrush or Ahrefs.
Once you have your TAM total for both years, compare them to quantify the YoY difference. In terms of a calculation, it would look something like this:
[Total volume: Relevant keywords in year A] - [Total volume: Relevant keywords in year B] = YoY change in market size
Is An External Factor Having An Impact?
Your business tactics could drive a jump or drop in performance, but it could be something that’s out of your control altogether.
Leadership will want to know whether it’s the “tide” or something the “boat” (your marketing team) is doing.
Sometimes, the quickest and easiest way to tell is to turn to search data — specifically our often-overlooked friend, Google Trends.
For the sake of example, let’s take a look at a simple case of an external factor driving increased demand for a service. Specifically, did the Olympics drive an increase in the demand for gymnastics lessons?
We know that the Olympics took place between Jul. 26 and Aug. 11, 2024. Now, we need to know how searches for “gymnastics lessons” in this window compare to other periods of time outside of the Olympics.
Screenshot from Google Trends, September 2024
It’s clear from the data that there was a significant increase in interest in gymnastics lessons during the Olympic window.
We see a much smaller increase during the window of the 2020 Olympics (Jul. 23 – Aug. 8, 2021), but we can probably attribute this to COVID-19 and related restrictions/behaviors.
This type of insight isn’t just valuable for gauging whether the industry tide affected performance.
It’s also invaluable for determining when to lean into specific products, information, or trends through levers such as increasing paid spend, launching social campaigns, or shifting the overall marketing mix to meet the moment.
How Does Demand For Our Brand Compare?
Search data allows us to compare active demand for Brand A to active demand for Brand B to answer this age-old question.
For this exercise, pull keyword volumes for any queries that contain Brand A’s name in the string. Then, do the same for Brand B over the same window of time.
Add the keyword volume for each respective brand to come up with the brand total. Then, calculate the difference to understand how they stack up.
[Total volume: Brand A branded KWs over X months] - [Total volume: Brand B branded KWs over X months] = Difference in active brand demand
Are We Visible Enough To Drive Awareness?
The search landscape is one big conversation. “Share of voice” can tell you how much of the conversation the brand is actually participating in.
This measurement takes the total keyword volume a brand is competing for as a percentage of the total volume of possible, relevant keyword opportunities for the brand.
Since only 0.44% of users visit the second page of search results, start by identifying keywords where a brand ranks on page one (either traditional placement, featured snippet, or AI Overviews). Because if it’s not on page one, a brand isn’t actually competing in most cases.
Calculate the aggregate volume for these keywords, divide it by the total volume across all relevant keyword opportunities (regardless of ranking), and multiply by 100.
( Brand-eligible keyword volume] / [Landscape keyword volume] ) x 100 = [% Share of Voice]
It Starts With A Simple Shift In Perspective
Looking at familiar numbers in new ways starts to unlock business-critical narratives.
And it doesn’t stop with search data!
Data from social media platforms and forum sites hold their own unique opportunities to understand markets even more through the lenses of engagement and consumer behavior.
Step one is making the mental shift from search data to demand data.
It’s a subtle shift that can take us out of our siloed way of looking at data. Breaking down those walls is the key to making digital market intelligence work for you.
Go forth and find those illuminating answers — at the speed of modern business.
It can also automatically import your ad campaigns from your Google Ads, Facebook, and Instagram accounts, create a new note when you publish an article, and annotate confirmed Google algorithm updates.
The tool offers a limited free version. Paid plans start at $39 per month with a free two-week trial.