What Is Largest Contentful Paint: An Easy Explanation via @sejournal, @vahandev
Largest Contentful Paint (LCP) is a Google user experience metric integrated into ranking systems in 2021.
LCP is one of the three Core Web Vitals (CWV) metrics that track technical performance metrics that impact user experience.
Core Web Vitals exist paradoxically, with Google providing guidance highlighting their importance but downplaying their impact on rankings.
LCP, like the other CWV signals, is useful for diagnosing technical issues and ensuring your website meets a base level of functionality for users.
What Is Largest Contentful Paint?
LCP is a measurement of how long it takes for the main content of a page to download and be ready to be interacted with.
Specifically, the time it takes from page load initiation to the rendering of the largest image or block of text within the user viewport. Anything below the fold doesn’t count.
Images, video poster images, background images, and block-level text elements like paragraph tags are typical elements measured.
LCP consists of the following sub-metrics:
Optimizing for LCP means optimizing for each of these metrics, so it takes less than 2.5 seconds to load and display LCP resources.
Here is a threshold scale for your reference:
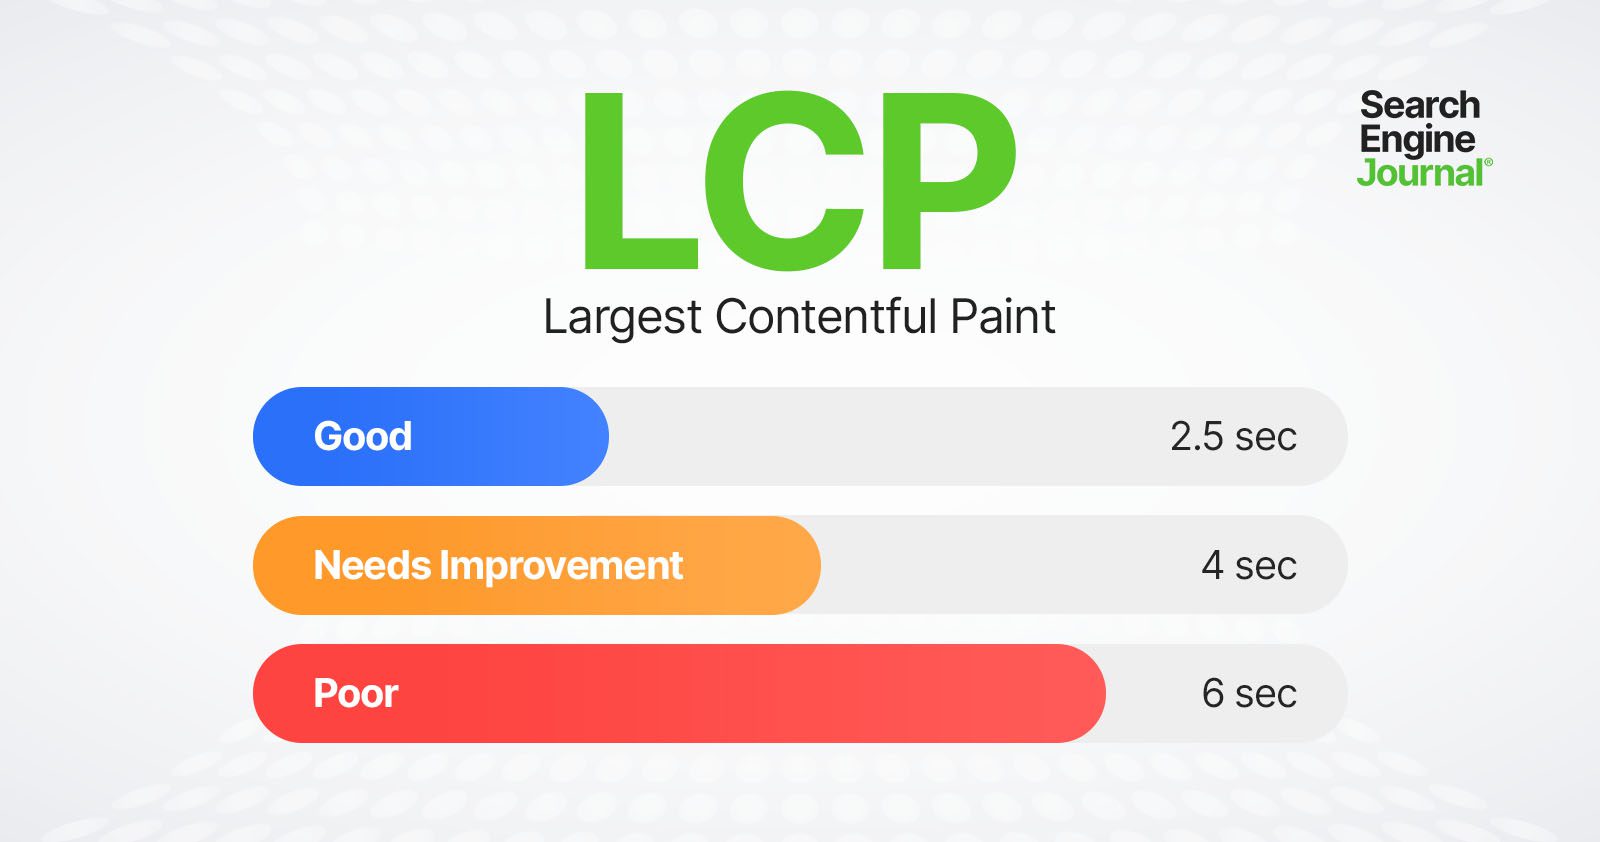 LCP thresholds
Let’s dive into what these sub-metrics mean and how you can improve.
Time To First Byte (TTFB)
TTFB is the server response time and measures the time it takes for the user’s browser to receive the first byte of data from your server. This includes DNS lookup time, the time it takes to process requests by server, and redirects.
Optimizing TTFB can significantly reduce the overall load time and improve LCP.
Server response time largely depends on:
- Database queries.
- CDN cache misses.
- Inefficient server-side rendering.
- Hosting.
Let’s review each:
1. Database Queries
If your response time is high, try to identify the source.
For example, it may be due to poorly optimized queries or a high volume of queries slowing down the server’s response time. If you have a MySQL database, you can log slow queries to find which queries are slow.
If you have a WordPress website, you can use the Query Monitor plugin to see how much time SQL queries take.
Other great tools are Blackfire or Newrelic, which do not depend on the CMS or stack you use, but require installation on your hosting/server.
2. CDN Cache Misses
A CDN cache miss occurs when a requested resource is not found in the CDN’s cache, and the request is forwarded to fetch from the origin server. This process takes more time, leading to increased latency and longer load times for the end user.
Usually, your CDN provider has a report on how many cache misses you have.
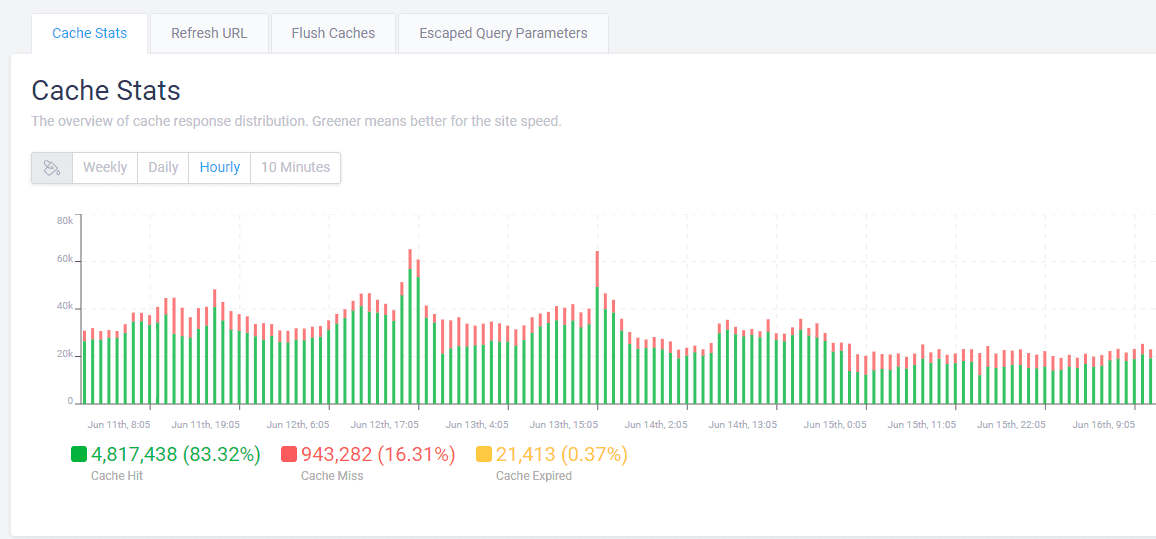 Example of CDN cache report
If you observe a high percentage ( >10% ) of cache misses, you may need to contact your CDN provider or hosting support in case you have managed hosting with cache integrated to solve the issue.
One reason that may cause cache misses is when you have a search spam attack.
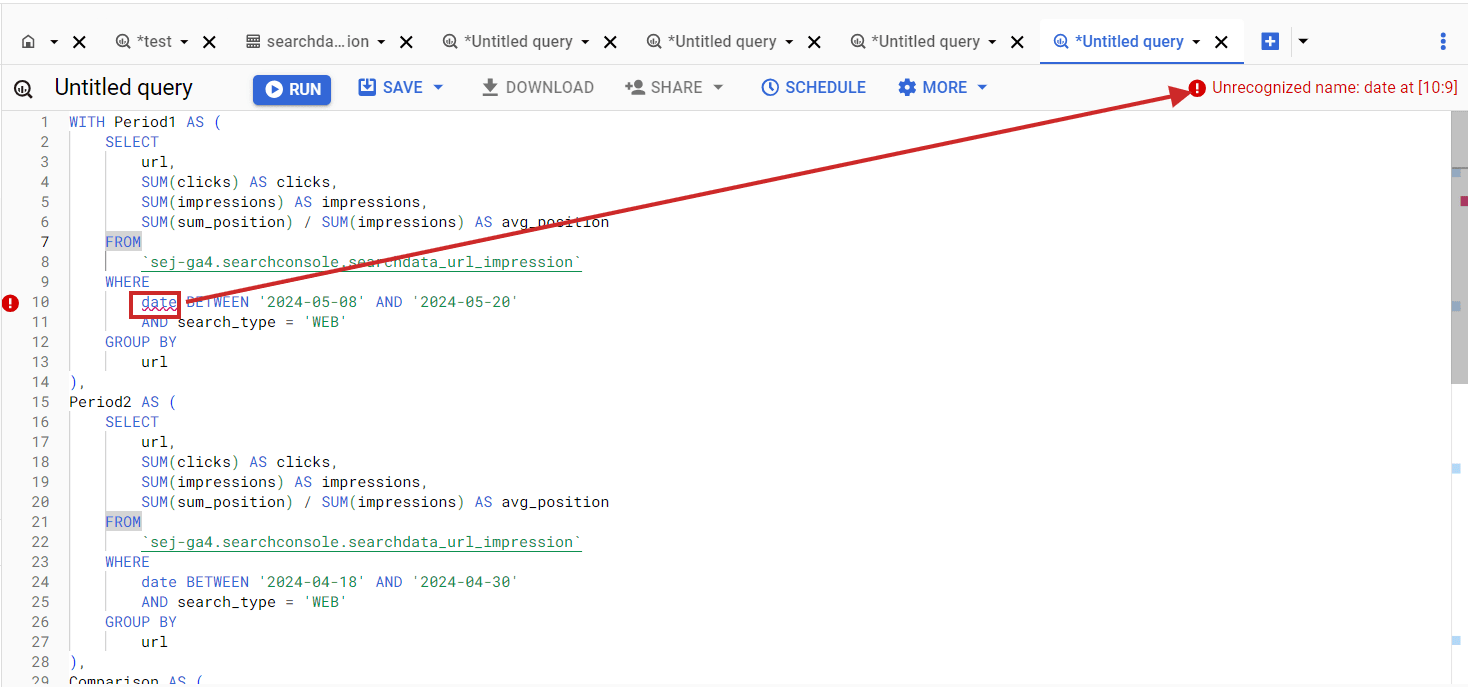
For example, a dozen spammy domains link to your internal search pages with random spammy queries like [/?q=甘肃代], which are not cached because the search term is different each time. The issue is that Googlebot aggressively crawls them, which may cause high server response times and cache misses.
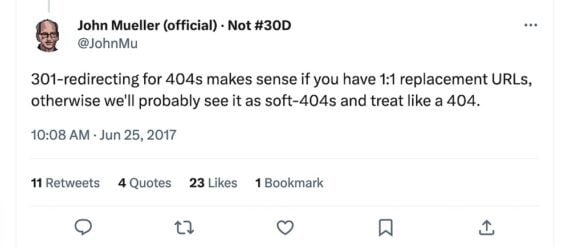
In that case, and overall, it is a good practice to block search or facets URLs via robots.txt. But once you block them via robots.txt, you may find those URLs to be indexed because they have backlinks from low-quality websites.
However, don’t be afraid. John Mueller said it would be cleared in time.
Here is a real-life example from the search console of high server response time (TTFB) caused by cache misses:
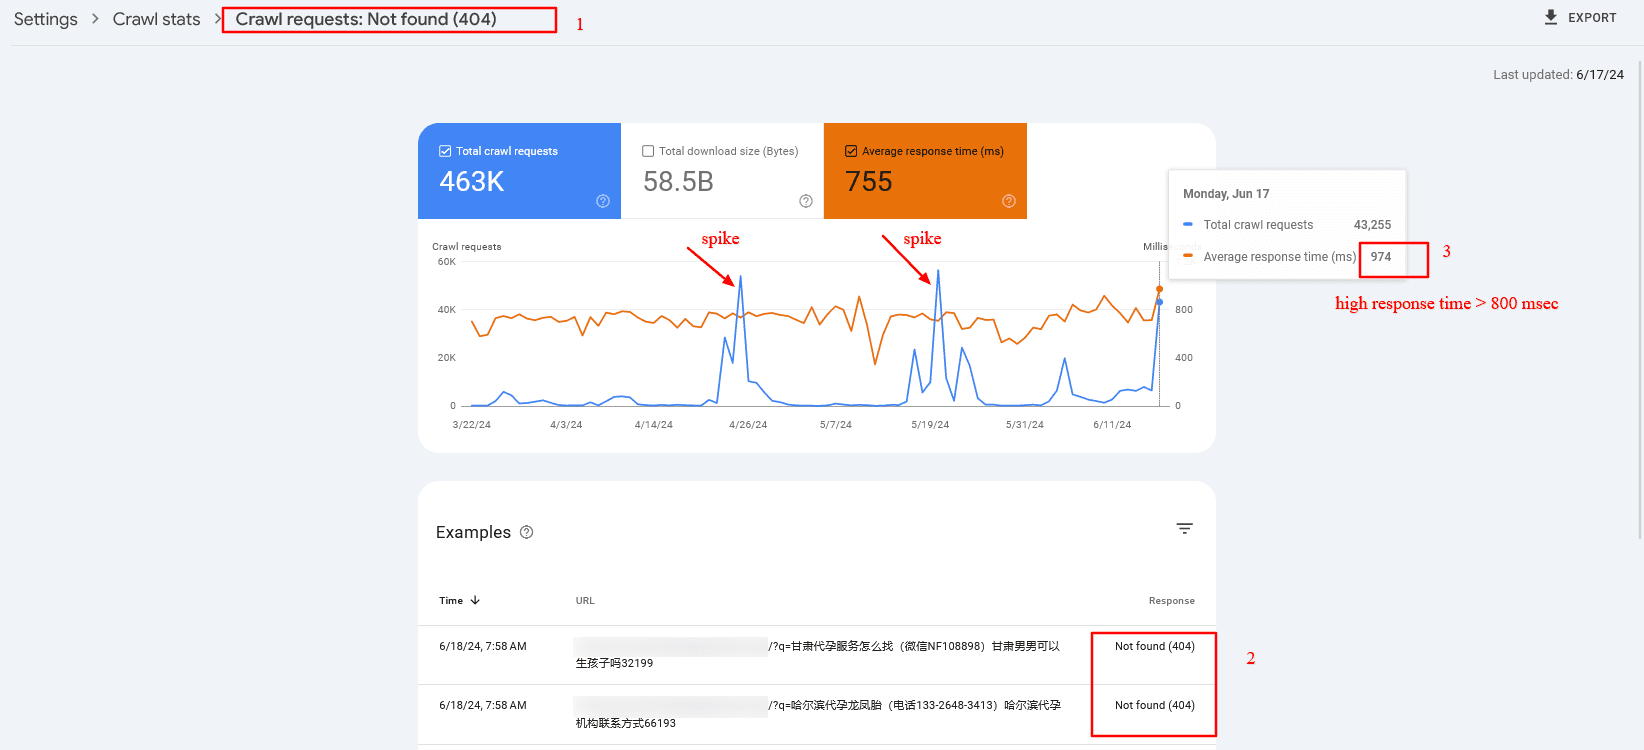 Crawl spike of 404 search pages that have high server response time
3. Inefficient Server Side Rendering
You may have certain components on your website that depend on third-party APIs.
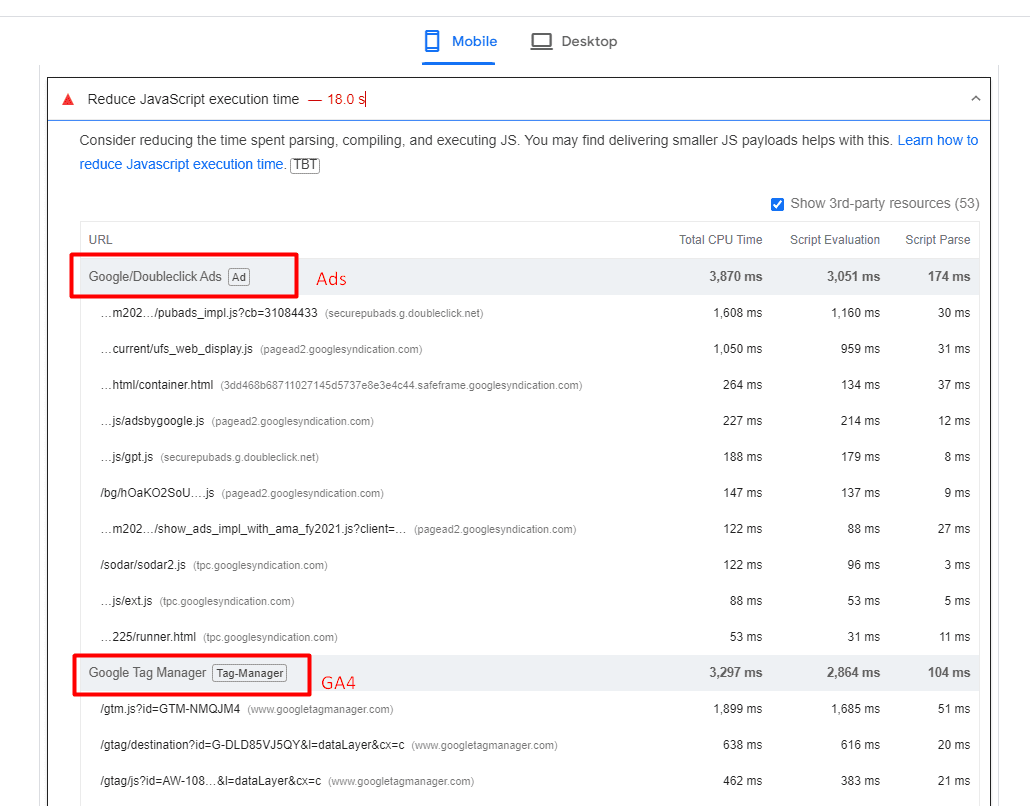
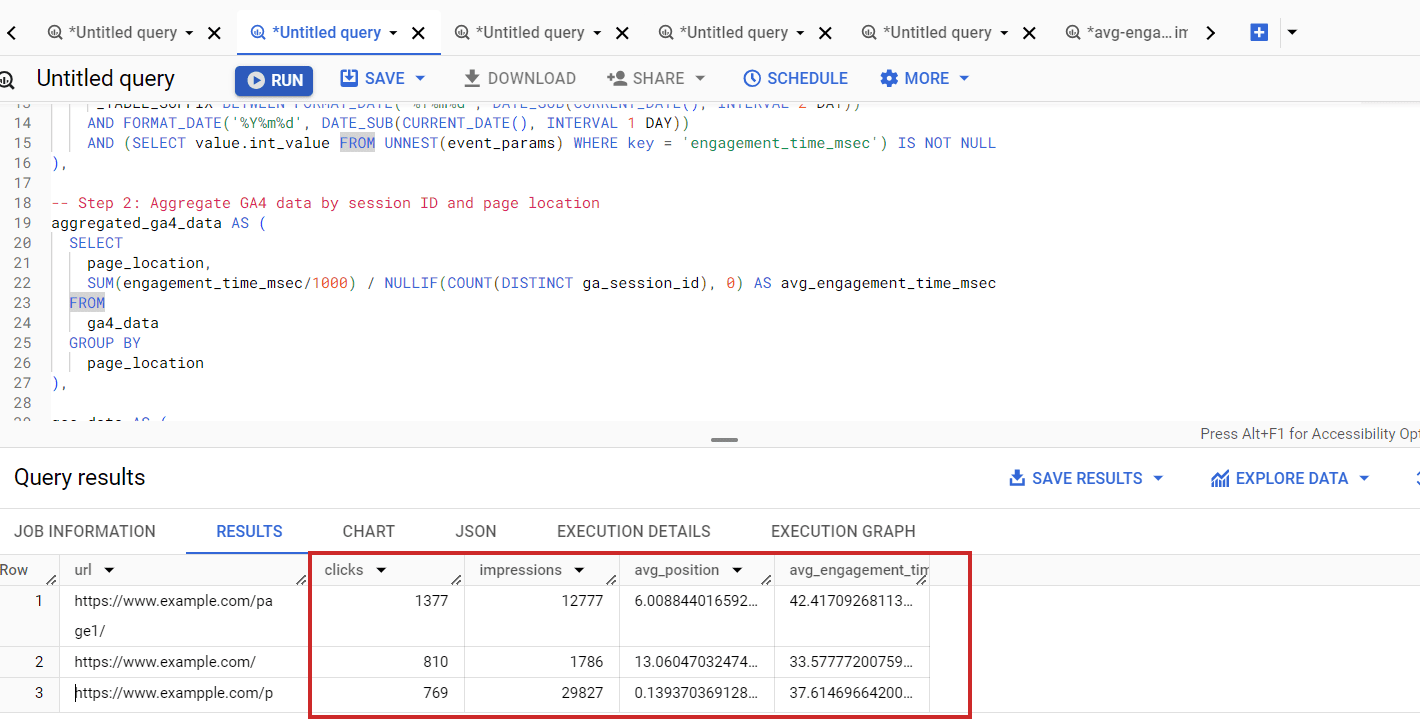
For example, you’ve seen reads and shares numbers on SEJ’s articles. We fetch those numbers from different APIs, but instead of fetching them when a request is made to the server, we prefetch them and store them in our database for faster display.
Imagine if we connect to share count and GA4 APIs when a request is made to the server. Each request takes about 300-500 ms to execute, and we would add about ~1,000 ms delay due to inefficient server-side rendering. So, make sure your backend is optimized.
4. Hosting
Be aware that hosting is highly important for low TTFB. By choosing the right hosting, you may be able to reduce your TTFB by two to three times.
Choose hosting with CDN and caching integrated into the system. This will help you avoid purchasing a CDN separately and save time maintaining it.
So, investing in the right hosting will pay off.
Read more detailed guidance:
Now, let’s look into other metrics mentioned above that contribute to LCP.
Resource Load Delay
Resource load delay is the time it takes for the browser to locate and start downloading the LCP resource.
For example, if you have a background image on your hero section that requires CSS files to load to be identified, there will be a delay equal to the time the browser needs to download the CSS file to start downloading the LCP image.
In the case when the LCP element is a text block, this time is zero.
By optimizing how quickly these resources are identified and loaded, you can improve the time it takes to display critical content. One way to do this is to preload both CSS files and LCP images by setting fetchpriority=”high” to the image so it starts downloading the CSS file.
But a better approach – if you have enough control over the website – is to inline the critical CSS required for above the fold, so the browser doesn’t spend time downloading the CSS file. This saves bandwidth and will preload only the image.
Of course, it’s even better if you design webpages to avoid hero images or sliders, as those usually don’t add value, and users tend to scroll past them since they are distracting.
Another major factor contributing to load delay is redirects.
If you have external backlinks with redirects, there’s not much you can do. But you have control over your internal links, so try to find internal links with redirects, usually because of missing trailing slashes, non-WWW versions, or changed URLs, and replace them with actual destinations.
There are a number of technical SEO tools you can use to crawl your website and find redirects to be replaced.
Resource Load Duration
Resource load duration refers to the actual time spent downloading the LCP resource.
Even if the browser quickly finds and starts downloading resources, slow download speeds can still affect LCP negatively. It depends on the size of the resources, the server’s network connection speed, and the user’s network conditions.
You can reduce resource load duration by implementing:
- WebP format.
- Properly sized images (make the intrinsic size of the image match the visible size).
- Load prioritization.
- CDN.
Element Render Delay
Element render delay is the time it takes for the browser to process and render the LCP element.
This metric is influenced by the complexity of your HTML, CSS, and JavaScript.
Minimizing render-blocking resources and optimizing your code can help reduce this delay. However, it may happen that you have heavy JavaScript scripting running, which blocks the main thread, and the rendering of the LCP element is delayed until those tasks are completed.
Here is where low values of the Total Blocking Time (TBT) metric are important, as it measures the total time during which the main thread is blocked by long tasks on page load, indicating the presence of heavy scripts that can delay rendering and responsiveness.
One way you can improve not only load duration and delay but overall all CWV metrics when users navigate within your website is to implement speculation rules API for future navigations. By prerendering pages as users mouse over links or pages they will most likely navigate, you can make your pages load instantaneously.
Beware These Scoring “Gotchas”
All elements in the user’s screen (the viewport) are used to calculate LCP. That means that images rendered off-screen and then shifted into the layout, once rendered, may not count as part of the Largest Contentful Paint score.
On the opposite end, elements starting in the user viewport and then getting pushed off-screen may be counted as part of the LCP calculation.
How To Measure The LCP Score
There are two kinds of scoring tools. The first is called Field Tools, and the second is called Lab Tools.
Field tools are actual measurements of a site.
Lab tools give a virtual score based on a simulated crawl using algorithms that approximate Internet conditions that a typical mobile phone user might encounter.
Here is one way you can find LCP resources and measure the time to display them via DevTools > Performance report:
You can read more in our in-depth guide on how to measure CWV metrics, where you can learn how to troubleshoot not only LCP but other metrics altogether.
LCP Optimization Is A Much More In-Depth Subject
Improving LCP is a crucial step toward improving CVW, but it can be the most challenging CWV metric to optimize.
LCP consists of multiple layers of sub-metrics, each requiring a thorough understanding for effective optimization.
This guide has given you a basic idea of improving LCP, and the insights you’ve gained thus far will help you make significant improvements.
But there’s still more to learn. Optimizing each sub-metric is a nuanced science. Stay tuned, as we’ll publish in-depth guides dedicated to optimizing each sub-metric.
More resources:
Featured image credit: BestForBest/Shutterstock