Charts: U.S. Retail Ecommerce Sales Q4 2023

The U.S. Department of Commerce reports quarterly total domestic retail sales and ecommerce only. Newly released figures (PDF) for Q4 2023 show ecommerce sales of $285.2 billion, a growth of 0.8% over the prior quarter.

Per the DoC, ecommerce sales are for “goods and services where the buyer places an order (or the price and terms of the sale are negotiated) over an Internet, mobile device, extranet, electronic data interchange network, electronic mail, or other comparable online system. Payment may or may not be made online.”

The DoC’s estimated total retail sales (online and in-store) for Q4 2023 stood at $1,831.4 billion, an increase of 0.4% from Q3 2023.

Ecommerce accounted for 15.6% of total U.S. retail sales in Q4 2023, up slightly from 15.5% in the prior quarter.

The DoC estimates U.S. ecommerce retail sales in Q4 2023 grew by 7.5% compared to Q4 2022, while total quarterly retail sales experienced a 2.8% annual rise in the same period.

Charts: Global Economic Outlook Q1 2024

Global growth is projected to stand at 3.1% in 2024 and 3.2% in 2025. That’s according to the International Monetary Fund’s January 2024 “World Economic Outlook” report, subtitled “Moderating Inflation and Steady Growth Open Path to Soft Landing.”

The IMF updates its economic outlook twice a year. The IMF’s forecasts use a “bottom-up” approach, starting with individual countries and then aggregating into overall global projections.

According to the IMF, growth in the United States is projected to fall from 2.5% in 2023 to 2.1% in 2024 and 1.7% in 2025. The euro region is expected to rebound from its low growth rate of 0.5% in 2023, which was influenced by exposure to the conflict in Ukraine, to 0.9% in 2024 and 1.7% in 2025.

The IMF projects growth in advanced economies will decline slightly from 1.6% in 2023 to 1.5% in 2024 before rising to 1.8% in 2025.

Meanwhile, in emerging markets and developing economies, growth is expected to remain at 4.1 percent in 2024 and to rise to 4.2 percent in 2025

According to the IMF, the global consumer inflation rate, including food and energy, will fall from an estimated 6.8% in 2023 to 5.8% in 2024 and 4.4% in 2025.

Get Started With GSC Queries In BigQuery

BigQuery has a number of advantages not found with other tools when it comes to analyzing large volumes of Google Search Console (GSC) data.

It lets you process billions of rows in seconds, enabling deep analysis across massive datasets.

This is a step up from Google Search Console, which only allows you to export 1,000 rows of data and may have data discrepancies.

You read all about why you should be using BigQuery as an SEO pro. You figured out how to plug GSC with BigQuery. Data is flowing!

Now what?

It’s time to start querying the data. Understanding and effectively querying the data is key to gaining actionable SEO insights.

In this article, we’ll walk through how you can get started with your queries.

Understanding GSC Data Structure In BigQuery

Data is organized in tables. Each table corresponds to a specific Google Search Console report. The official documentation is very extensive and clear.

However, if you are reading this, it’s because you want to understand the context and the key elements before diving into it.

Taking the time to figure this out means that you will be able to create better queries more efficiently while keeping the costs down.

GSC Tables, Schema & Fields In BigQuery

Schema is the blueprint that maps what each field (each piece of information) represents in a table.

You have three distinct schemas presented in the official documentation because each table doesn’t necessarily hold the same type of data. Think of tables as dedicated folders that organize specific types of information.

Each report is stored separately for clarity. You’ve got:

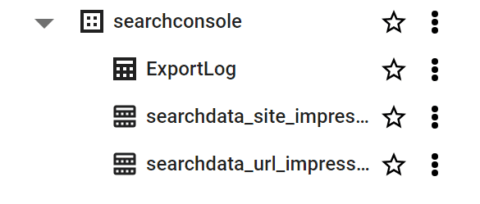
  • searchdata_site_impression: Contains performance data for your property aggregated by property.
  • searchdata_url_impression: Contains performance data for your property aggregated by URL.
  • exportLog: each successful export to either table is logged here.

A few important notes on tables:

  • You’ll find in the official documentation that things don’t run the way we expect them to: “Search Console exports bulk data once per day, though not necessarily at the same time for each table.”
  • Tables are retained forever, by default, with the GSC bulk export.
  • In the URL level table (searchdata_url_impression), you have Discover data. The field is_anonymized_discover specifies if the data row is subject to the Discover anonymization threshold.

Fields are individual pieces of information, the specific type of data in a table. If this were an Excel file, we’d refer to fields as the columns in a spreadsheet.

If we’re talking about Google Analytics, fields are metrics and dimensions. Here are key data fields available in BigQuery when you import GSC data:

  • Clicks – Number of clicks for a query.
  • Impressions – Number of times a URL was shown for a query.
  • CTR – Clickthrough rate (clicks/impressions).
  • Position – Average position for a query.

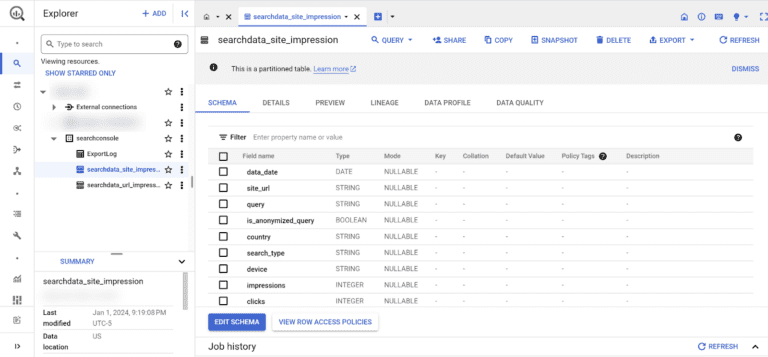
Let’s take the searchdata_site_impression table schema as an example. It contains 10 fields:

Field Explanation
data_date The day when the data in this row was generated, in Pacific Time.
site_url URL of the property, sc-domain:property-name or the full URL, depending on your validation.
query The user’s search query.
is_anonymized_query If true, the query field will return null.
country Country from which the search query originated.
search_type Type of search (web, image, video, news, discover, googleNews).
device The device used by the user.
impressions The number of times a URL was shown for a particular search query.
clicks The number of clicks a URL received for a search query.
sum_top_position This calculation figures out where your website typically ranks in search results. It looks at the highest position your site reaches in different searches and calculates the average.

Putting It Together

In BigQuery, the dataset for the Google Search Console (GSC) bulk export typically refers to the collection of tables that store the GSC data.

The dataset is named “searchconsole” by default.

BigQuery search console tables

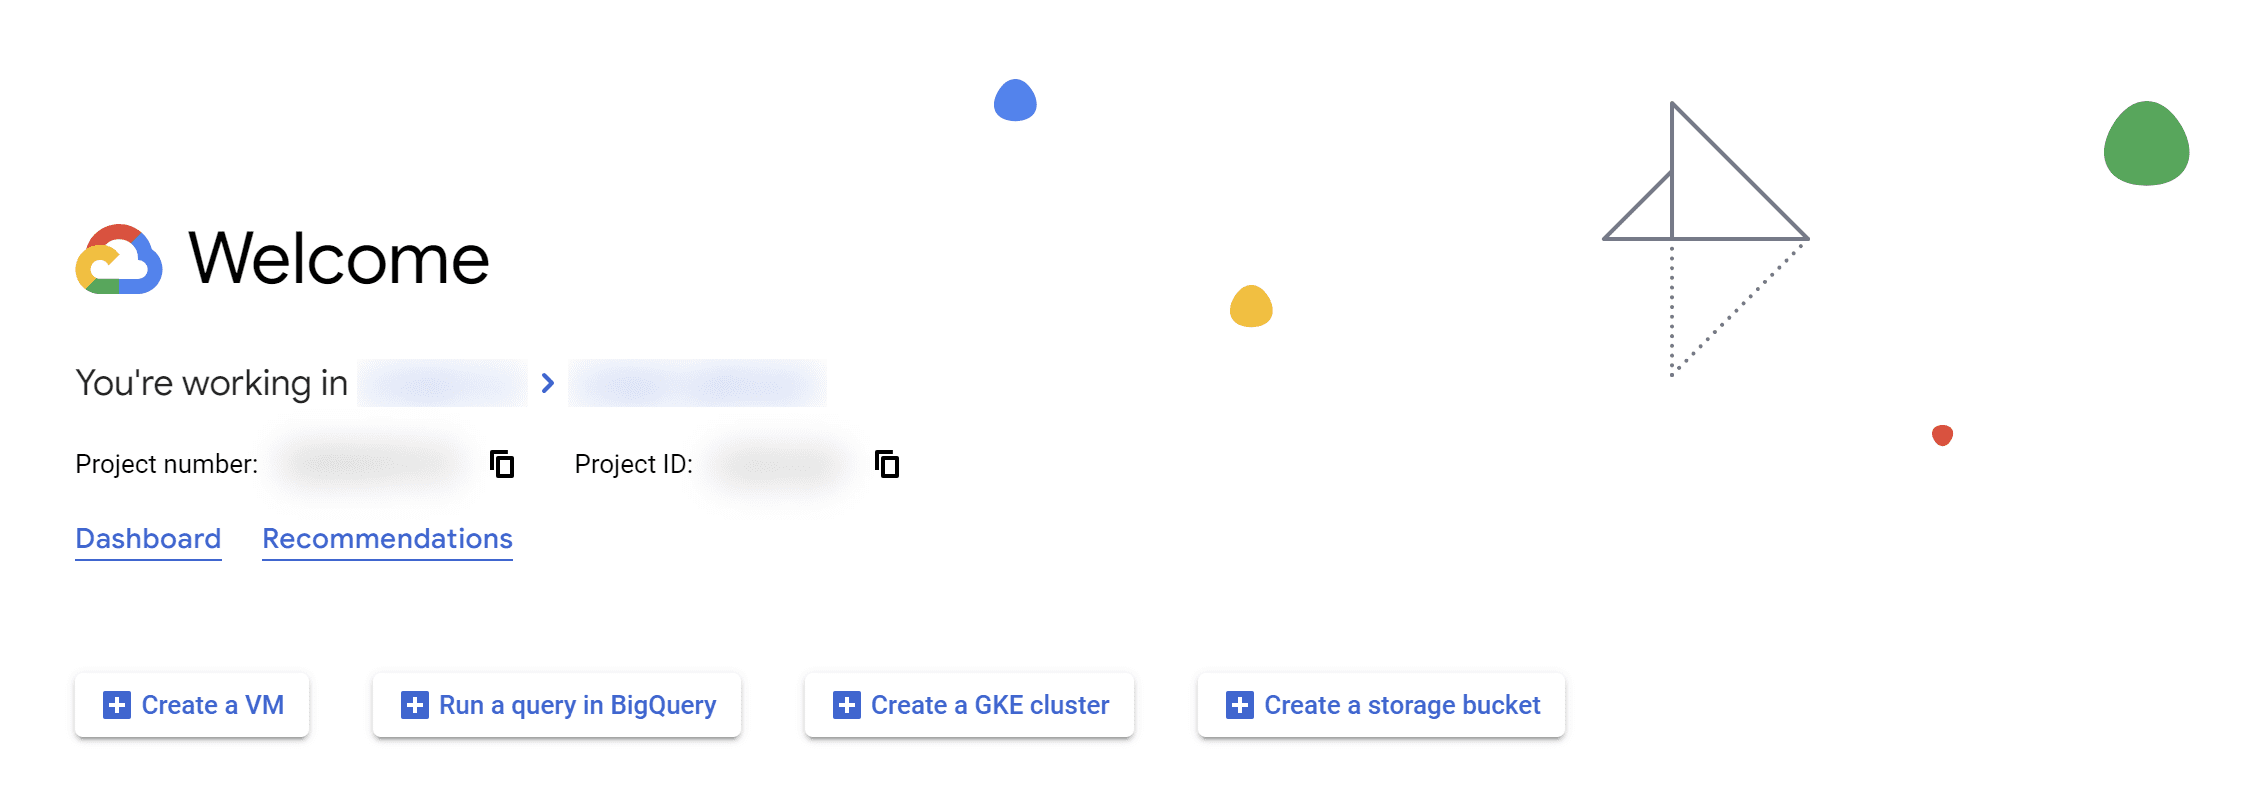
Unlike the performance tab in GSC, you have to write queries to ask BigQuery to return data. To do that, you need to click on the “Run a query in BigQuery” button.

Run SQL query option among three other options on the welcome screenScreenshot from Google Cloud Console, January 2024

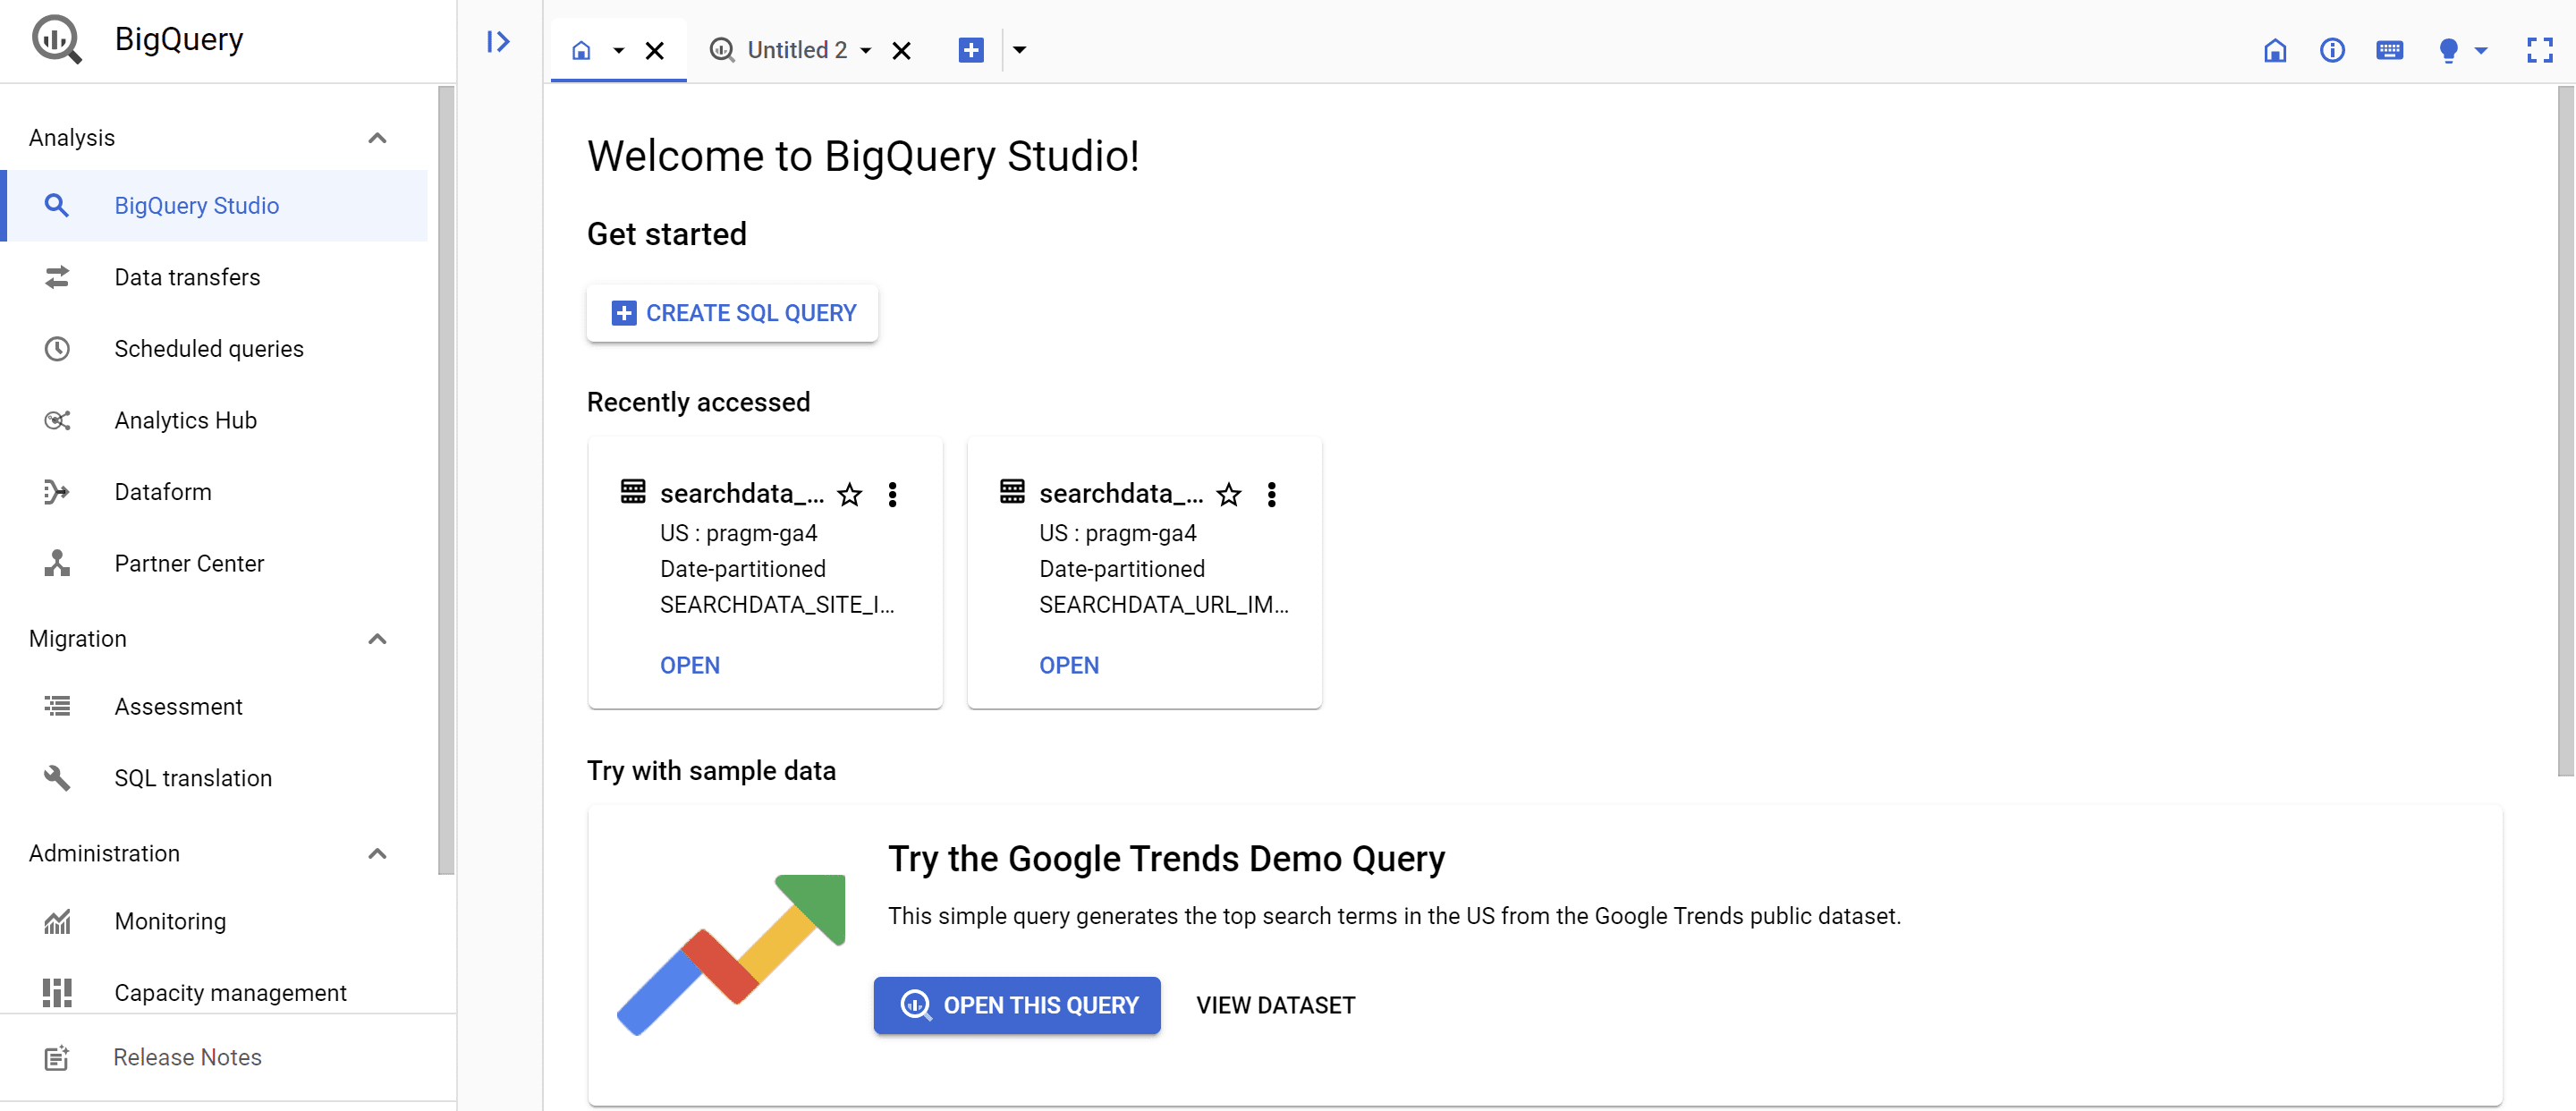
Once you do that, you should have access to the BigQuery Studio, where you will be creating your first SQL query. However, I don’t recommend you click on that button yet.

access screen to the BigQuery Studio where you will be creating your first SQL query. Screenshot of BigQuery Studio, January 2024

In Explorer, when you open your project, you will see the datasets; it’s a logo with squares with dots in them. This is where you see if you have GA4 and GSC data, for instance.

data set for search impression table

When you click on the tables, you get access to the schema. You can see the fields to confirm this is the table you want to query.

If you click on “QUERY” at the top of the interface, you can create your SQL query. This is better because it loads up some information you need for your query.

It will fill out the FROM with the proper table, establish a default limit, and the date that you can change if you need to.

 If you click on “QUERY” at the top in the interface, you can create your SQL query. This is better because it loads up some information you need for your query.Screenshot from Google Cloud Console, January 2024

Getting Started With Your First Query

The queries we are going to discuss here are simple, efficient, and low-cost.

Disclaimer: The previous statement depends on your specific situation.

Sadly, you cannot stay in the sandbox if you want to learn how to use BigQuery with GSC data. You must enter your billing details. If this has you freaked out, fear not; costs should be low.

  • The first 1 TiB per month of query data is free.
  • If you have a tight budget, you can set cloud billing budget alerts — you can set a BigQuery-specific alert and get notified as soon as data usage charges occur.

In SQL, the ‘SELECT *’ statement is a powerful command used to retrieve all columns from a specified table or retrieve specific columns as per your specification.

This statement enables you to view the entire dataset or a subset based on your selection criteria.

A table comprises rows, each representing a unique record, and columns, storing different attributes of the data. Using “SELECT *,” you can examine all fields in a table without specifying each column individually.

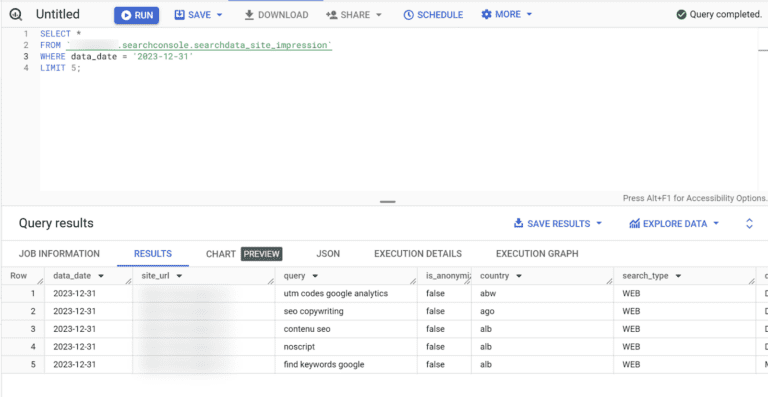
For instance, to explore a Google Search Console table for a specific day, you might employ a query like:

SELECT *

FROM `yourdata.searchconsole.searchdata_site_impression`

WHERE data_date = '2023-12-31'

LIMIT 5;

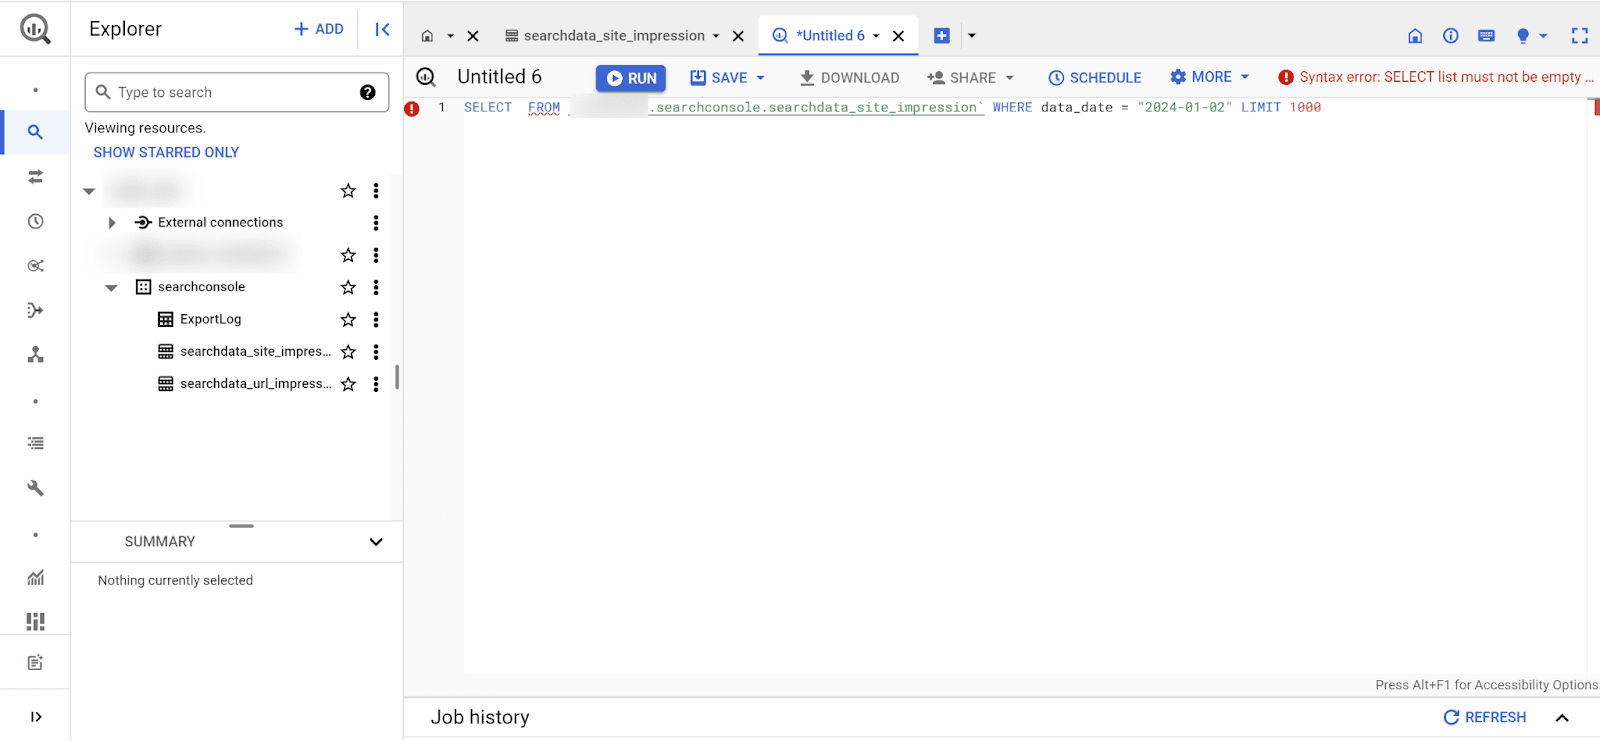
You always need to make sure that the FROM clause specifies your searchdata_site_impression table. That’s why it is recommended to start by clicking the table first, as it automatically fills in the FROM clause with the right table.

Important: We limit the data we load by using the data_date field. It’s a good practice to limit costs (along with setting a limit).

results from the first query we made shown in a table format

Your First URL Impression Query

If you want to see information for each URL on your site, you’d ask BigQuery to pull information from the ‘searchdata_url_impression’ table, selecting the ‘query’ and ‘clicks’ fields.

This is what the query would look like in the console:

SELECT

url,

SUM(clicks) AS clicks,

SUM(impressions)

FROM

`yourtable.searchdata_url_impression`

WHERE

data_date = ‘2023-12-25’

GROUP BY

url

ORDER BY

clicks DESC

LIMIT

100

You always need to make sure that the FROM clause specifies your searchdata_url_impression table.

When you export GSC data into BigQuery, the export contains partition tables. The partition is the date.

This means that the data in BigQuery is structured in a way that allows for quick retrieval and analysis based on the date.

That’s why the date is automatically included in the query. However, you may have no data if you select the latest date, as the data may not have been exported yet.

Breakdown Of The Query

In this example, we select the URL, clicks, and impressions fields for the 25th of December, 2023.

We group the results based on each URL with the sum of clicks and impressions for each of them.

Lastly, we order the results based on the number of clicks for each URL and limit the number of rows (URLs) to 100.

Recreating Your Favorite GSC Report

I recommend you read the GSC bulk data export guide. You should be using the export, so I will not be providing information about table optimization. That’s a tad bit more advanced than what we are covering here.

GSC’s performance tab shows one dimension at a time, limiting context. BigQuery allows you to combine multiple dimensions for better insights

Using SQL queries means you get a neat table. You don’t need to understand the ins and outs of SQL to make the best use of BigQuery.

This query is courtesy of Chris Green. You can find some of his SQL queries in Github.

SELECT

query,

is_anonymized_query AS anonymized,

SUM(impressions) AS impressions,

SUM(clicks) AS clicks,

SUM(clicks)/NULLIF(SUM(impressions), 0) AS CTR

FROM

yourtable.searchdata_site_impression

WHERE

data_date >= DATE_SUB(CURRENT_DATE(), INTERVAL 28 DAY)

GROUP BY

query,

anonymized

ORDER BY

clicks DESC

This query provides insights into the performance of user queries over the last 28 days, considering impressions, clicks, and CTR.

It also considers whether the queries are anonymized or not, and the results are sorted based on the total number of clicks in descending order.

This recreates the data you would normally find in the Search Console “Performance” report for the last 28 days of data, results by query, and differentiating anonymized queries.

Feel free to copy/paste your way to glory, but always make sure you update the FROM clause with the right table name. If you are curious to learn more about how this query was built, here is the breakdown:

  • SELECT clause:
    • query: Retrieves the user queries.
    • is_anonymized_query AS anonymized: Renames the is_anonymized_query field to anonymized.
    • SUM(impressions) AS impressions: Retrieves the total impressions for each query.
    • SUM(clicks) AS clicks: Retrieves the total clicks for each query.
    • SUM(clicks)/NULLIF(SUM(impressions), 0) AS CTR: Calculates the Click-Through Rate (CTR) for each query. The use of NULLIF prevents division by zero errors.
  • FROM clause:
    • Specifies the source table as mytable.searchconsole.searchdata_site_impression.
  • WHERE clause:
    • Filters the data to include only rows where the data_date is within the last 28 days from the current date.
  • GROUP BY clause:
    • Groups the results by query and anonymized. This is necessary since aggregations (SUM) are performed, and you want the totals for each unique combination of query and anonymized.
  • ORDER BY clause:
    • Orders the results by the total number of clicks in descending order.

Handling The Anonymized Queries

According to Noah Learner, the Google Search Console API delivers 25 times more data than the GSC performance tab for the same search, providing a more comprehensive view.

In BigQuery, you can also access the information regarding anonymized queries.

It doesn’t omit the rows, which helps analysts get complete sums of impressions and clicks when you aggregate the data.

Understanding the volume of anonymized queries in your Google Search Console (GSC) data is key for SEO pros.

When Google anonymizes a query, it means the actual search query text is hidden in the data. This impacts your analysis:

  • Anonymized queries remove the ability to parse search query language and extract insights about searcher intent, themes, etc.
  • Without the query data, you miss opportunities to identify new keywords and optimization opportunities.
  • Not having query data restricts your capacity to connect search queries to page performance.

The First Query Counts The Number Of Anonymized Vs. Not Anonymized Queries

SELECT

CASE

WHEN query is NULL AND is_anonymized_query = TRUE THEN "no query"

ELSE

"query"

END

AS annonymized_query,

count(is_anonymized_query) as query_count

FROM

`yourtable.searchdata_url_impression`

GROUP BY annonymized_query

Breakdown Of The Query

In this example, we use a CASE statement in order to verify for each row if the query is anonymized or not.

If so, we return “no query” in the query field; if not, “query.”

We then count the number of rows each query type has in the table and group the results based on each of them. Here’s what the result looks like:

anonymized queries shown in results

Advanced Querying For SEO Insights

BigQuery enables complex analysis you can’t pull off in the GSC interface. This means you can also create customized intel by surfacing patterns in user behavior.

You can analyze search trends, seasonality over time, and keyword optimization opportunities.

Here are some things you should be aware of to help you debug the filters you put in place:

  • The date could be an issue. It may take up to two days for you to have the data you want to query. If BigQuery says on the top right corner that your query would require 0mb to run, it means the data you want isn’t there yet or that there is no data for your query.
  • Use the preview if you want to see what a field will return in terms of value. It shows you a table with the data.
  • The country abbreviations you will get in BigQuery are in a different format (ISO-3166-1-Alpha-3 format) than you are used to. Some examples: FRA for France, UKR for Ukraine, USA for the United States, etc.
  • Want to get “pretty” queries? Click on “more” within your query tab and select “Format query.” BigQuery will handle that part for you!
  • If you want more queries right away, I suggest you sign up for the SEOlytics newsletter, as there are quite a few SQL queries you can use.

Conclusion

Analyzing GSC data in BigQuery unlocks transformative SEO insights, enabling you to track search performance at scale.

By following the best practices outlined here for querying, optimizing, and troubleshooting, you can get the most out of this powerful dataset.

Reading this isn’t going to make you an expert instantly. This is the first step in your adventure!

If you want to know more, check out Jake Peterson’s blog post, start practicing for free with Robin Lord’s Lost at SQL game, or simply stay tuned because I have a few more articles coming!

If you have questions or queries, do not hesitate to let us know.

More resources:


Featured Image: Tee11/Shutterstock

Charts: 2024 Outlook of Global CEOs

Forty-five percent of global CEOs believe their company will not remain viable in the next decade if it continues on its current trajectory. That’s according to the 27th annual global CEO survey issued earlier this month by PwC, which queried 4,702 CEOs in 105 countries and territories in November 2023.

However, CEOs are now twice as likely to anticipate an improvement in the global economy this year compared to a year ago.

CEOs expect greater impacts from technology, customer preferences, and climate change in the coming three years versus the past five.

As of November 2023, CEOs perceived fewer imminent threats in the short term, with inflation being the top concern.

The Federal Reserve Bank of New York’s monthly “Business Leaders Survey” asks executives about recent and expected trends in key business indicators. The January 2024 edition (PDF) queried roughly 200 service firms in the New York City region from Jan. 3 to 10.

The survey solicits the views of executives of those firms on multiple indicators from the prior month, such as revenue, employee count, forecasts, and more. The result is a “Business Activity Index,” the sum of favorable responses less unfavorable. If 50% of respondents answered favorably and 20% unfavorably, the index would be 30.

In January 2024, the index climbed 12 points to 24.5, suggesting that firms were more optimistic about future conditions compared to the previous month.

Charts: U.S. Consumer Outlook Q1 2024

U.S. consumers are carefully monitoring their spending amid ongoing global uncertainty. That’s according to “US consumer sentiment: Caution heading into 2024,” a research post last month from McKinsey & Company.

The economic outlook of U.S. consumers remained relatively stable throughout 2023, with a slight increase in optimism.

Consumers’ spending plans in Q1 2024 signaled a priority on essential items such as baby supplies, gasoline, and food.

Seventy-seven percent of surveyed Americans reported engaging in some form of spending reduction in Q4 2023.

The U.S. Bureau of Economic Analysis, a division of the Department of Commerce, publishes the monthly “Personal Consumption Expenditures Index,” a gauge of U.S. consumer spending. According to the BEA, consumer spending on goods and services increased by 0.3% in November 2023 over the prior month.

Essential GA4 Reports You Need To Measure Your SEO Campaigns (Festive Flashback) via @sejournal, @coreydmorris

Celebrate the Holidays with some of SEJ’s best articles of 2023.

Our Festive Flashback series runs from December 21 – January 5, featuring daily reads on significant events, fundamentals, actionable strategies, and thought leader opinions.

2023 has been quite eventful in the SEO industry and our contributors produced some outstanding articles to keep pace and reflect these changes.

Catch up on the best reads of 2023 to give you plenty to reflect on as you move into 2024.


It has been hard to not hear about or talk about GA4 over the past year.

It has been one of Google’s most talked about updates within the SEO community and much more broadly – despite not being directly tied to SEO strategy or tactics.

Google Analytics has been the popular platform for monitoring, measuring, and understanding engagement with our websites. While reports, types of data (“not provided” anyone?), and specific features have changed over the years, usage of the platform hasn’t waned.

Now that Google Analytics’ Universal Analytics has reached the end of its lifetime, It’s time to get familiar with GA4.

Whether you migrated months ago, were auto-migrated by Google, or are getting started from scratch, I want to share five essential reports that you need to know to measure your SEO campaigns and efforts.

Traffic Acquisition Report

Let’s start with what I would consider to be the most important and relevant report, Traffic Acquisition. The report is meant to help site owners understand where visitors are coming from before landing on the site.

So why would this be important for SEO purposes?

The traffic acquisition report allows you to measure how your SEO campaigns stack up against other channels and within integrated marketing efforts as a whole.

How many visitors come from organic search compared to search? How engaged are organic visitors compared to those coming from email? There are so many comparisons and details to dig into here.

This is one of the first and most important data sources for connecting many of the dots between natural and intentional influences you have over getting audiences to your website content.

GA4 Traffic Acquisition ReportScreenshot from GA4, June 2023

By default, GA4 utilizes a data-driven attribution model, which incorporates an algorithm to determine how to give credit to different channels throughout a user’s journey.

While data-driven attribution could be used in Universal Analytics, it is much more expansive in GA4, taking into account more than 50 different touch points for accurate attribution.

The metrics that can be viewed in the Traffic Acquisition Report include:

  • Average engagement.
  • Conversions.
  • Engaged sessions.
  • Engaged sessions per user.
  • Engagement rate.
  • Event count.
  • Events per sessions.
  • Sessions.
  • Total revenue.
  • Users.
GA4 Traffic Acquisition Report ChannelsScreenshot from GA4, June 2023

Conversion Reports

Conversion reports are important to SEOs for their ability to track the events that led a visitor to a conversion made on the website.

The report will indicate what triggered a conversion by registering conversions based on their event name and how you assigned credit to the conversion based on your attribution model.

The default report includes conversions, total revenue, and total users metrics.

GA4 Conversion ReportScreenshot from GA4, June 2023

Setting up conversions in GA4 is different than it was in Universal Analytics.

In UA, goals were used to indicate conversions, while GA4 utilizes events. At setup, GA4 has a number of existing events that can be marked as conversions based on your marketing goals.

Existing events include:

  • clicks.
  • first_visit.
  • page_view.
  • scroll.
  • session_start.
  • submit_form.
  • view_search_results.

In most cases, you will want to configure your own events to track conversions that align better with your conversion funnel.

For websites focused on generating leads, form submissions will typically be the primary conversions. While GA4 will track submit_form actions natively, it likely won’t provide enough data to be as valuable as you need.

For instance, a newsletter submission lead may be at a different part of the funnel or be a secondary goal versus a contact form submission. We recommend creating a custom event tag using Google Tag Manager.

As mentioned in the Traffic Acquisition Report section, GA4 uses a data-driven attribution model so that conversions can be more accurately attributed to the proper channel as visitors engage with the site through various touch points.

Google Search Console Reports

Google Search Console is one of the most important sources of performance data and information for SEO pros and, just like with Universal Analytics, users can integrate GSC with GA4.

Similar to UA, there are two reports in GA4 associated with Search Console:

  • Google Organic Search Queries: This report lets you see GSC metrics by search query.
  • Google Organic Search Traffic: This report shows landing pages with both Search Console and Analytics metrics.

The Search Console reports are unpublished by default. In order to view the reports, you will need to add a new Search Console link property through the admin settings.

GA4 Search Console Report How T0Screenshot from GA4, June 2023

Under the properties section, find the “Search Console Link” button.

GA4 Search Console Report How To

GA4 Search Console Report How ToScreenshots from GA4, June 2023

While the reports in GA4 won’t be able to completely replace the level of organic reporting found in GSC, there is value in having the data on one platform.

The biggest value is that site owners can see how organic visitors engage with the site as it pertains to specific landing pages.

GA4 Search Console landing pages reportScreenshot from GA4, June 2023

What is the value of the data provided by the Google Organic Search Traffic Report for landing pages compared to the insights offered by the more broadly named Landing Page Report (which I’ll detail in the next section)?

The Google Search Console Report offers a comprehensive understanding of landing pages and your website’s visibility in Google’s search results.

It provides detailed metrics such as impressions, clicks, click-through rates, and keywords, which are crucial in driving organic traffic to your landing pages.

In comparison, the Landing Page Reports within GA4 offer a broader perspective by analyzing various traffic sources, including organic search, direct traffic, and referrals.

While both reports offer valuable insights, The Google Search Console Report specifically focuses on the visibility and performance of landing pages within Google’s search results.

It provides in-depth data to evaluate organic search traffic and keyword performance.

GA4 Search Console Landing Page ReportScreenshot from GA4, June 2023

On the downside, there are a few limitations to the Search Console integration with GA4. Unfortunately, GA4 allows for only one data stream to link to a search console.

Landing Page Reports

The Landing Page report helps you understand which pages on your website receive the most organic traffic.

By analyzing this data, you can identify high-performing pages that are attracting organic visitors and optimize other pages accordingly. You can also evaluate the bounce rate, average time on page, and conversion rate for each landing page to further refine your SEO strategy.

In the GA4 Landing Page report, site owners can easily toggle secondary dimensions to see how a landing page stacks up based on where users are coming from.

In the Landing Page report, you can easily see how a page is driving traffic to users at different stages of the funnel using different secondary dimensions.

For instance, adding “Session source/medium” will allow you to see where a user is currently at in their journey, while “First user source/medium” will show how users first interacted with the site.

Conclusion

Whether you’re new to Google Analytics and are figuring out GA4 as your first foray into the Google Analytics ecosystem or have migrated and are getting your bearings, knowing your way around and where to prioritize time and focus is important.

Whether we like the new features, bemoan what isn’t in GA4, or just need some time to adjust, it is here, and we will surely adapt to it and find new and deeper ways to leverage our website data.

As always, please remember that data is data, whether from Universal Analytics, GA4, or any other measurement platform. What is most important is what we do with the data, how we integrate it, leverage it, and find meaningful insights.

Keep your measurement plan and what matters to you as a focal point as you connect the data with your marketing and SEO goals and objectives.

Google Tag Manager Contains Hidden Data Leaks & Vulnerabilities via @sejournal, @martinibuster

Researchers uncover data leaks in Google Tag Manager (GTM) as well as security vulnerabilities, arbitrary script injections and instances of  consent for data collection enabled by default. A legal analysis identifies potential violations of EU data protection law.

There are many troubling revelations including that server-side GTM “obstructs compliance auditing endeavors from regulators, data protection officers, and researchers…”

GTM, developed by Google in 2012 to assist publishers in implementing third-party JavaScript scripts, is currently used on as many as 28 million websites. The research study evaluates both versions of GTM, the Client-side and the newer Server-side GTM that was introduced in 2020.

The analysis, undertaken by researchers and legal experts, revealed a number of issues inherent to the GTM architecture.

An examination of 78 Client-side Tags, 8 Server-side Tags, and two Consent Management Platforms (CMPs), revealed hidden data leaks, instances of Tags bypassing GTM permission systems in order to inject scripts, and consent set to enabled by default without any user interaction.

A significant finding pertains to the Server-side GTM. Server-side GTM works by loading and executing tags on a remote server, which creates the perception of the absence of third parties on the website.
However, the study showed that this architecture allows tags running on the server to clandestinely share users’ data with third parties, circumventing browser restrictions and security measures like like the Content-Security-Policy (CSP).

Methodology Used In Research On GTM Data Leaks

The researchers are from Centre Inria de l’Université, Centre Inria d’Université Côte d’Azur, Centre Inria de l’Université, and Utrecht University.

The methodology used by the researchers was to buy a domain and install GTM on a live website.

The research paper explains in detail:

“To conduct experiments and set up the GTM infrastructure, we bought a domain – we call it example.com here – and created a public website containing one basic webpage with a paragraph of text and an HTML login form. We have included a login form since Senol et al. …have recently found that user input is often leaked from the forms, so we decided to test whether Tags may be responsible for such leakage.

The website and the Server-side GTM infrastructure were hosted on a virtual machine we rented on the Microsoft Azure cloud computing platform located in a data center in the EU.

…We used the ‘profiles’ functionality of the browser to start every experiment in a fresh environment, devoid from cookies, local storage and other technologies than maintain a state.

The browser, visiting the website, was run on a computer connected to the Internet through an institutional network in the EU.

To create Client- and Server-side GTM installations, we created a new Google account, logged into it and followed the suggested steps in the official GTM documentation.”

The results of the analysis contain multiple critical findings, including that the “Google Tag” facilitates collecting multiple types of users’ data without consent and at the time of analysis it presented a security vulnerability.

Data Collection Is Hidden From Publishers

Another discovery was the extent of data collection by the “Pinterest Tag,” which garnered a significant amount of user data without disclosing it to the Publisher.

What some may find disturbing is that publishers who deploy these tags may not only be unaware of the data leaks but that the tools they rely on to help them monitor data collection don’t notify them of these issues.

The researchers documented their findings:

“We observe that the data sent by the Pinterest Tag is not visible to the Publisher on the Pinterest website, where we logged in to observe Pinterest’s disclosure about collected data.

Moreover, we find that the data collected by the Google Tag about form interaction is not shown in the Google Analytics dashboard.

This finding demonstrates that for such Tags, Publishers are not aware of the data collected by the Tags that they select.”

Injections of Third Party Scripts

Google Tag Managers has a feature for controlling tags, including third party tags, called Web Containers. The tags can run inside a sandbox that limits their functionalities. The sandbox also uses a permission system with one permission called inject_script that allows a script to download and run any (arbitrary) script outside of the Web Container.

The inject_script permission allows the tag to bypass the GTM permission system to gain access to all browser APIs and DOM.

Screenshot Illustrating Script Injection

Google Tag Manager script injection

The researchers analyzed 78 officially supported Client-side tags and discovered 11 tags that don’t have the inject_script permission but can inject arbitrary scripts. Seven of those eleven tags were provided by Google.

They write:

“11 out of 78 official Client-side tags inject a third-party script into the DOM bypassing the GTM permission system; and GTM “Consent Mode” enables some of the consent purposes by default, even before the user has interacted with the consent banner.”

The situation is even worse because it’s not just a privacy vulnerability, it’s also a security vulnerability.

The research paper explains the meaning of what they uncovered:

“This finding shows that the GTM permission system implemented in the Web Container sandbox allows Tags to insert arbitrary, uncontrolled scripts, thus opening potential security and privacy vulnerabilities to the website. We have disclosed this finding to Google via their Bug Bounty online system.”

Consent Management Platforms (CMP)

Consent Management Platforms (CMP) are a technology for managing what consent users have granted in terms of their privacy. This is a way to manage ad personalization, user data storage, analytics data storage and so on.

Google’s documentation for CMP usage states that setting the consent mode defaults is the responsibility of the marketers and publishers who use the GTM.

The defaults can be set to deny ad personalizaton by default, for example.

The documentation states:

Set consent defaults
We recommend setting a default value for each consent type you are using.

The consent state values in this article are only examples. You are responsible for making sure that default consent mode is set for each of your measurement products to match your organization’s policy.”

What the researchers discovered is that CMPs for Client-side GTMs are loaded in an undefined state on the webpage and that becomes problematic when a CMP does not load default variables (referred to as undefined variables).

The problem is that GTM considers undefined variables to mean that users have given their consent to all of the undefined variables, even though the user has not consented in any way.

The researchers explained what’s happening:

“Surprisingly, in this case, GTM considers all such undefined variables to be accepted by the end user, even though the end user has not interacted with the consent banner of the CMP yet.

Among two CMPs tested (see §3.1.1), we detected this behavior for the Consentmanager CMP.

This CMP sets a default value to only two consent variables – analytics_storage and ad_storage – leaving three GTM consent variables – security_-storage , personalization_storage functionality_storage – and consent variables specific to this CMP – e.g., cmp_purpose_c56 which corresponds to the “Social Media” purpose – in undefined state.

These extra variables are hence considered granted by GTM. As a result, all the Tags that depend on these four consent variables get executed even without user consent.”

Legal Implications

The research paper notes that United States privacy laws like the European Union General Data Protection Regulation (GDPR) and the ePrivacy Directive (ePD) regulate the processing of user data and the use of tracking technologies and impose significant fines for violations of those laws, such as requiring consent for the storage of cookies and other tracking technologies.

A legal analysis of the Client-Side GTM flagged a total of seven potential violations.

Seven Potential Violations Of Data Protection Laws

  • Potential violation 1. CMP scanners often miss purposes
  • Potential violation 2. Mapping CMP purposes to GTM consent variables is not compliant.
  • Potential violation 3. GTM purposes are limited to clientside storage.
  • Potential violation 4. GTM purposes are not specific nor explicit.
  • Potential violation 5. Defaulting consent variables to “accepted” means that Tags run without consent.
  • Potential violation 6. Google Tag sends data independently of user’s consent decisions.
  • Potential violation 7. GTM allows Tag Providers to inject scripts exposing end users to security risks.

Legal analysis of Server-Side GTM

The researchers write that the findings raise legal concerns about GTM in its current state. They assert that the system introduces more legal challenges than resolutions, complicating compliance efforts and posing a challenge for regulators to monitor effectively.

These are some of the factors that caused concern about the ability to comply with regulations:

  • Complying with data subject rights is hard for the Publisher
    For both Client- and Server-Side GTM there is no easy way for a publisher to comply with a request for access to collected data as required by Article 15 of the GDPR. The publisher would have to manually track down every Data Collector to comply with that legal request.
  • Built-in consent raises trust issues
    When using tags with built-in consent, publishers are forced to trust that Tag Providers actually implement the built-in consent within the code. There’s no easy way for a publisher to review the code to verify that the Tag Provider is actually ignoring the consent and collecting user information. Reviewing the code is impossible for official tags that are sandboxed within the gtm.js script. The researchers state that reviewing the code for compliance “requires heavy reverse engineering.”
  • Server-side GTM is invisible for regulatory monitoring and auditing
    The researchers write that Server-side GTM blocks obstructs compliance auditing because the data collection occurs remotely on a server.
  • Consent is hard to configure on GTM Server Containers
    Consent management tools are missing in GTM Server Containers, which prevents CMPs from displaying the purposes and the Data Collectors as required by regulations.

Auditing is described as highly difficult:

“Moreover, auditing and monitoring is exclusively attainable by only contacting the Publisher to grant access to the configuration of the GTM Server Container.

Furthermore, the Publisher is able to change the configuration of the GTM Server Container at any point in time (e.g., before any regulatory investigation), masking any compliance check.”

Conclusion: GTM Has Pitfalls And Flaws

The researchers were gave GTM poor marks for security and the non-compliant defaults, stating that it introduces more legal issues than solutions while complicating the compliance with regulations and making it hard for regulators to monitor for compliance.

Read the research paper:

Google Tag Manager: Hidden Data Leaks and its Potential Violations under EU Data Protection Law

Download the PDF of the research paper here.

Featured Image by Shutterstock/Praneat

Google Maps: New Location Data Controls & Ability To Delete Visits via @sejournal, @kristileilani

In a move to increase user privacy, Google Maps launched updates to give users more control over location data storage and recent activity.

With these updates, users will be able to manage their Location History with greater precision. The changes could, however, affect analytics data marketers utilize for location targeting.

Timeline Storage On Local Device

First, the Timeline feature in Google Maps, a tool that assists users in recalling places they have been, is receiving a significant privacy-oriented update.

Google Maps: New Location Data Controls & Ability To Delete VisitsScreenshot from Google, December 2023

Users with Location History turned on will soon find that their Timeline will be stored directly on their devices rather than on cloud servers.

This storage decision gives users extra autonomy over their location data and the assurance that it remains private.

For those switching phones or worried about device loss, there is the option to back up their Timeline to the cloud.

Impact On Marketers

On-device storage and deletion tools could limit the amount of user location data available for ad targeting, potentially impacting campaigns that rely heavily on location-based targeting.

Updated Location History Controls

When Google Maps users activate the auto-delete function for Location History, it will have a default three-month lifecycle. Previously, this default setting was set to 18 months.

Google Maps: New Location Data Controls & Ability To Delete VisitsScreenshot from Google, December 2023

Users can customize this option to keep location data longer or turn off location tracking.

Impact On Marketers

Users may be more cautious about sharing location data, leading to changes in search behavior and potentially impacting the effectiveness of location-based keywords and ad copy.

Ads emphasizing user privacy and control might resonate better with users, like highlighting opt-in features for location sharing or transparent data usage policies.

Delete Recent Activity In Location History

In the upcoming weeks, support for managing location information related to specific places directly in the Maps app will be introduced.

Google Maps: New Location Data Controls & Ability To Delete VisitsScreenshot from Google, December 2023

Adding to the convenience, the blue dot in Google Maps, which symbolizes the user’s current location, will now act as a quick access point to location settings.

A simple tap will display whether Location History or Timeline is engaged and if Maps can access device location data.

This feature could be valuable for shopping for the holidays or planning a surprise by allowing users to cover their digital tracks.

Impact On Marketers

If the changes to Google Maps result in less location data, contextual targeting based on user interests and online behavior might become more important.

Conclusion

These updates, which will gradually roll out over the next year on Android and iOS, demonstrate Google’s commitment to user privacy.


Featured image: Ralf Liebhold/Shutterstock

Google Analytics 4 Features To Prepare For Third-Party Cookie Depreciation via @sejournal, @kristileilani

Google will roll out new features and integrations for Google Analytics 4 (GA4) for first-party data, enhanced conversions, and durable ad performance metrics.

Beginning in Q1 2024, Chrome will gradually phase out third-party cookies for a percentage of users, allowing for testing and transition.

Third-party cookies, which have been central to cross-site tracking, are being restricted or phased out by major browsers, including Chrome, as part of its Privacy Sandbox project.

The following features should help advertisers “unlock durable performance” while preserving user privacy.

Support For Protected Audience API In GA4

A key feature of recent updates to Google Analytics 4 is the integration of Protected Audience API, a Privacy Sandbox technology that is set to become widely available in early 2024.

This API allows advertisers to continue reaching their audiences after the third-party cookie phase-out.

What Is The Protected Audience API?

The Protected Audience API offers a novel approach to remarketing, which involves reminding users about sites and products they have shown interest in without relying on third-party cookies.

google analytics 4 privacy sandbox protected audience API lifecycleScreenshot from Google, December 2023

This method involves advertisers informing the browser directly about their interest in showing ads to users in the future.

The browser then uses an algorithm to determine which ads to display based on the user’s web activity and advertiser inputs.

It enables on-device auctions by the browser, allowing it to choose relevant ads from sites previously visited by the user without tracking their browsing behavior across different sites.

Key Features And Development

Key features of the Protected Audience API include interest groups stored by the browser, on-device bidding and ad selection, and ad rendering in a temporarily relaxed version of Fenced Frames.

The API also supports a key/value service for real-time information retrieval, which can be used by both buyers and sellers for various purposes, such as budget calculation or policy compliance.

The Protected Audience API, initially known as the FLEDGE API, has evolved from an experimental stage to a more mature phase, reflecting its readiness for wider implementation.

This transition is part of Google’s broader efforts to develop privacy-preserving APIs and technologies in collaboration with industry stakeholders and regulatory bodies like the UK’s Competition and Markets Authority.

The Protected Audience API offers a new way to connect with users while respecting their privacy, necessitating a reevaluation of current advertising strategies and a focus on adapting to these emerging technologies.

Support For Enhanced Conversions

Rolling out in the next few weeks, enhanced conversions is a feature enhancing conversion measurement accuracy.

enhanced conversion for webScreenshot from Google, December 2023

Enhanced conversions for the web cater to advertisers tracking online sales and events. It captures and hashes customer data like email addresses during a conversion on the web, then matches this with Google accounts linked to ad interactions.

This method recovers unmeasured conversions, optimizes bidding, and maintains data privacy.

For leads, enhanced conversions track sales from website leads occurring offline. It uses hashed data from website forms, like email addresses, to measure offline conversions.

Setup options for enhanced conversions include Google Tag Manager, a Google tag, or the Google Ads API, with third-party partner support available.

Advertisers can import offline conversion data for Google Ads from Salesforce, Zapier, and HubSpot with Google Click Identifier (GCLID).

Proper Consent Setup

To effectively use Google’s enhanced privacy features, it’s essential to have proper user consent mechanisms in place, particularly for traffic from the European Economic Area (EEA).

Google’s EU user consent policy mandates consent collection for personal data usage in measurement, ad personalization, and remarketing features. This policy extends to website tags, app SDKs, and data uploads like offline conversion imports.

Google has updated the consent mode API to include parameters for user data consent and personalized advertising.

Advertisers using Google-certified consent management platforms (CMPs) will see automatic updates to the latest consent mode, while those with self-managed banners should upgrade to consent mode v2.

Implementing consent mode allows you to adjust Google tag behavior based on user consent, ensuring compliance and enabling conversion modeling for comprehensive reporting and optimization.

Consent Mode integration with CMPs simplifies managing consent banners and the consent management process, adjusting data collection based on user choices and supporting behavioral modeling for a complete view of consumer performance.

Durable Ad Performance With AI Essentials

To effectively utilize AI, marketers need robust measurement and audience tools for confident decision-making.

Google provided a general checklist of AI essentials for Google advertisers. In it, advertisers are encouraged to adopt AI-powered search and Performance Max campaigns, engage in Smart Bidding, and explore video campaigns on platforms like YouTube.

Google also offers a more in-depth checklist for Google Ads, Display & Video 360, and Campaign Manager 360.

google ads durable performance measurement aiScreenshot from Google, December 2023

More Ways To Prepare For The Third-Party Cookie Phase Out

As third-party cookies are phased out, it’s essential to audit and modify web code, especially focusing on instances of SameSite=None using tools like Chrome DevTools.

Adapting to this change involves understanding and managing both third-party and first-party cookies, ensuring they are set correctly for cross-site contexts and compliance.

Chrome provides solutions like Partitioned cookies with CHIPS and Related Website Sets.

At the same time, the Privacy Sandbox introduces APIs for privacy-centric alternatives, with additional support for enterprise-managed Chrome and ongoing development of tools and trials to assist in the transition.

As Google continues to update resources and documentation to reflect these changes, stakeholders are encouraged to engage and provide feedback, ensuring that the evolution of these technologies aligns with industry needs and user privacy standards.


Featured image: Primakov/Shutterstock

2023 Survey Review: State Of Marketing Data Standards In The AI Era via @sejournal, @hethr_campbell

Claravine and Advertiser Perceptions surveyed 140 marketers and agencies to better understand the impact of data standards on marketing data, and they’re ready to present their findings.

Want to learn how you can mitigate privacy risks and boost ROI through data standards?

Watch this on-demand webinar and learn how companies are addressing new privacy laws, taking advantage of AI, and organizing their data to better capture the campaign data they need, as well as how you can implement these findings in your campaigns.

In this webinar, you will:

  • Gain a better understanding of how your marketing data management compares to enterprise advertisers.
  • Get an overview of the current state of data standards and analytics, and how marketers are managing risk while improving the ROI of their programs.
  • Walk away with tactics and best practices that you can use to improve your marketing data now.

Chris Comstock, Chief Growth Officer at Claravine, will show you the marketing data trends of top advertisers and the potential pitfalls that come with poor data standards.

Learn the key ways to level up your data strategy to pinpoint campaign success.

View the slides below or check out the full webinar for all the details.

Join Us For Our Next Webinar!

SaaS Marketing: Expert Paid Media Tips Backed By $150M In Ad Spend

Join us and learn a unique methodology for growth that has driven massive revenue at a lower cost for hundreds of SaaS brands. We’ll dive into case studies backed by real data from over $150 million in SaaS ad spend per year.