GA4 Five Years Later: The Current State Of Marketing Analytics

As a marketing specialist who has gone through the transition from Universal Analytics to Google Analytics 4 on countless projects, I can confidently say that no platform migration has divided the marketing community quite like GA4.

Five years after the initial launch of GA4 in October 2020, and more than a year since the complete Universal Analytics shutdown, it’s time for an honest review of where we stand with Google’s flagship analytics platform.

The Great Migration: A Bumpy Road To The Future

When Google announced in March 2022 that Universal Analytics would stop processing data by July 2023, the marketing world was in shock. The short window between the announcement and the sunset date caught many marketers off guard, causing mild panic among companies and website owners.

What followed was one of the most contentious platform migrations in digital marketing history.

Starting July 1, 2023, standard Universal Analytics properties stopped processing hits, with Universal Analytics 360 properties receiving a one-time processing extension ending on July 1, 2024.

For many of us who had spent over a decade mastering Universal Analytics, this wasn’t just a platform change; it was the end of an era.

The fundamental shift from UA’s session-based model to GA4’s event-based architecture represented more than a technical upgrade. It was a complete reimagining of how we measure and understand user behavior.

While Google positioned this as future-proofing for a privacy-first, cross-device world, the reality on the ground was far more challenging.

The Promise Vs. The Reality

Google’s marketing pitch for GA4 was compelling: enhanced user journey tracking, privacy-compliant measurement, advanced machine learning, and more intuitive reporting.

As someone who eagerly adopted GA4 early, I was excited about these possibilities. However, the execution has been a mixed bag at best.

The User Experience Crisis

Perhaps the most important criticism of GA4 has been its user interface, with widespread negative feedback from the marketing community.

The interface complaints aren’t just about aesthetics; they’re about productivity. Tasks that took two clicks in Universal Analytics now require six or more steps in GA4. Filtering for a single page, something marketers do dozens of times daily, has become an exercise in frustration.

Data Reliability Concerns

Beyond usability issues, GA4 has struggled with data reliability problems that strike at the heart of marketing decision-making.

According to Piwik PRO’s analysis, conversion tracking discrepancies, inaccurate traffic reports, integration problems with Google Ads, and discrepancies between GA4 data and BigQuery exports have been persistent issues since launch.

These aren’t minor technical glitches; they’re fundamental problems that affect how we measure campaign performance and allocate marketing budgets.

The shift from UA’s goal-based conversion tracking to GA4’s event-based system has created confusion around what we’re actually measuring, particularly when comparing year-over-year performance.

Signs Of Progress: Recent Improvements

To Google’s credit, it hasn’t ignored the criticism. The past year has seen several meaningful updates that address some of the most pressing concerns.

Google Analytics has introduced a Generated Insights feature that summarizes trends and changes in data, helping users make quicker decisions. These insights are displayed at the top of detail reports and include action buttons for report modifications. This AI-powered analysis is genuinely helpful for identifying patterns that might otherwise be missed.

The addition of Anomaly Detection in detail reports automatically flags any unexpected spikes or dips in your data, represented as circles on your charts. For busy marketers juggling multiple campaigns, this proactive approach to data monitoring is a welcome improvement.

Perhaps most significantly for agencies and enterprises, as of March 2025, GA4 finally supports the ability to copy reports and explorations from one property to another. If you’ve ever had to manually rebuild the same custom reports across multiple client accounts, you’ll appreciate how much time this saves.

The Broader Impact On Marketing Analytics

The GA4 transition has forced the entire marketing analytics landscape to evolve. Current data shows that over 15 million websites use GA4, making it the de facto standard for web analytics regardless of individual opinions about the platform.

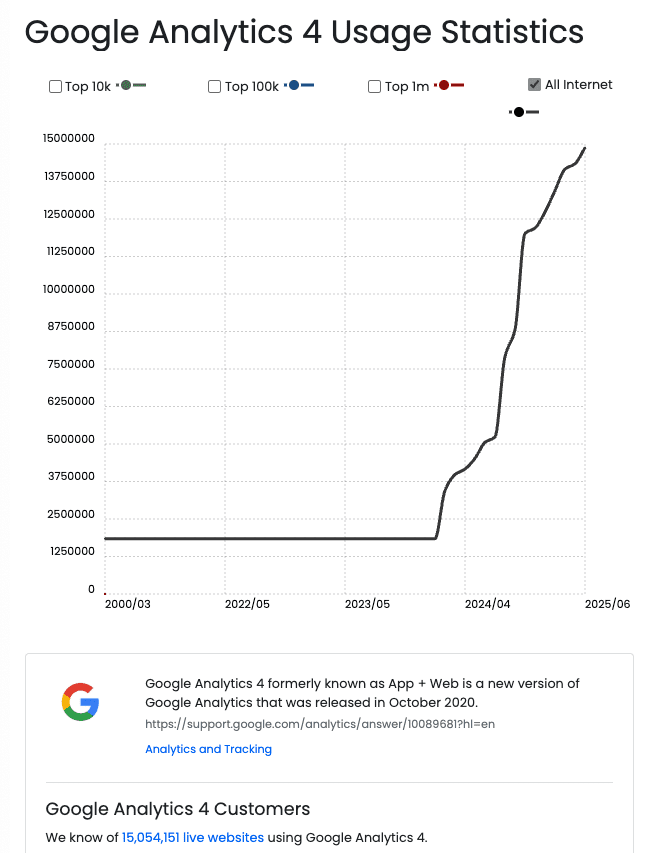
Screenshot from trends.builtwith.com, August 2025

Looking into historical Universal adoption, more than 21 million websites used Universal Analytics, which leaves a gap to be filled. So, despite GA4 leading the analytics industry, it still has a long way to reach the former adoption rate, which creates some sort of vacuum.

This shift has had several unintended consequences. Many organizations have diversified their analytics stack, supplementing GA4 with specialized tools that fill specific gaps. There is an increased interest in alternatives like Matomo for privacy-focused measurement and more sophisticated attribution modeling platforms for enterprise users.

The emphasis on first-party data collection has also intensified. With the end of third-party cookies and stricter consent rules, website data coverage will decrease, limiting your leverage.

First-party data will become even more important than ever. This has pushed marketing teams to become more strategic about data collection and customer relationship building.

Practical Recommendations For Marketing Teams

After five years of working with GA4, here’s my advice for marketing teams struggling with the transition:

Invest In Education

The learning curve has been steep, but unavoidable.

As former Google Analytics team member Krista Seiden wisely noted:

“The only way to learn a new tool is to dive in and actually get your feet wet.” Budget time and resources for proper training.

Focus On Trends, Not Absolutes

When comparing year-over-year performance, focus on trends and seasonality rather than absolute numbers. GA4’s different measurement methodology means exact numerical comparisons with UA data are largely meaningless.

Supplement Strategically

Don’t try to make GA4 do everything. Identify specific gaps in your analytics needs and fill them with specialized tools.

Many successful marketing teams now use GA4 as their foundation while leveraging additional platforms for detailed attribution, customer journey mapping, or real-time optimization.

Embrace The Event-Based Model

Rather than fighting GA4’s event-based structure, lean into it. Google recommends implementing new logic that makes sense in the event-based context rather than simply copying over existing event logic from UA. This approach will yield better insights in the long run.

Looking Forward

Cookie deprecation and enhanced privacy regulations mean that features like enhanced conversions, consent mode V2, and offline conversion tracking are now necessary rather than nice-to-haves. GA4, despite its flaws, is better positioned for this privacy-first future than Universal Analytics ever was.

The platform will undoubtedly continue improving. Google has shown responsiveness to user feedback, and the recent updates demonstrate a commitment to addressing the most pressing usability concerns. However, marketers should expect GA4 to remain more complex and technical than its predecessor.

The Bottom Line

Five years after its launch, GA4 represents both the promise and peril of modern marketing analytics. It offers capabilities that Universal Analytics couldn’t match: cross-platform tracking, privacy compliance, and AI-powered insights. Yet, it also demands a level of technical sophistication that many marketing teams struggle to achieve.

The forced migration was undoubtedly painful, and the criticism of GA4’s usability is largely justified. However, the platform is here to stay, and fighting that reality serves no one. The organizations that will thrive are those that invest in proper GA4 implementation, supplement it strategically with other tools, and adapt their processes to work with rather than against its event-based philosophy.

As marketers, we’ve weathered platform changes before, and we’ll weather this one, too. The key is approaching GA4 not as a replacement for Universal Analytics, but as a fundamentally different tool for a fundamentally different digital landscape. Once we make that mental shift, GA4 becomes less frustrating and more powerful.

The future of marketing analytics is privacy-first, cross-platform, and AI-enhanced. GA4, for all its current limitations, is our best free gateway to that future. It’s time to stop mourning Universal Analytics and start mastering what comes next.

More Resources:


Featured Image: kenchiro168/Shutterstock

Can AEO/GEO Startups Beat Established SEO Tool Companies? via @sejournal, @martinibuster

The CEO of Conductor started a LinkedIn discussion about the future of AI SEO platforms, suggesting that the established companies will dominate and that 95 percent of the startups will disappear. Others argued that smaller companies will find their niche and that startups may be better positioned to serve user needs.

Besmertnik published his thoughts on why top platforms like Conductor, Semrush, and Ahrefs are better positioned to provide the tools users will need for AI chatbot and search visibility. He argued that the established companies have over a decade of experience crawling the web and scaling data pipelines, with which smaller organizations cannot compete.

Conductor’s CEO wrote:

“Over 30 new companies offering AI tracking solutions have popped up in the last few months. A few have raised some capital to get going. Here’s my take: The incumbents will win. 95% of these startups will flatline into the SaaS abyss.

…We work with 700+ enterprise brands and have 100+ engineers, PMs, and designers. They are all 100% focused on an AI search only future. …Collectively, our companies have hundreds of millions of ARR and maybe 1000x more engineering horsepower than all these companies combined.

Sure we have some tech debt and legacy. But our strengths crush these disadvantages…

…Most of the AEO/GEO startups will be either out of business or 1-3mm ARR lifestyle businesses in ~18 months. One or two will break through and become contenders. One or two of the largest SEO ‘incumbents’ will likely fall off the map…”

Is There Room For The “Lifestyle” Businesses?

Besmertnik’s remarks suggested that smaller tool companies earning one to three million dollars in annual recurring revenue, what he termed “lifestyle” businesses, would continue as viable companies but stood no chance of moving upward to become larger and more established enterprise-level platforms.

Rand Fishkin, cofounder of SparkToro, defended the smaller “lifestyle” businesses, saying that it feels like cheating at business, happiness, and life.

He wrote:

“Nothing better than a $1-3M ARR “lifestyle” business.

…Let me tell you what I’m never going to do: serve Fortune 500s (nevermind 100s). The bureaucracy, hoops, and friction of those orgs is the least enjoyable, least rewarding, most avoid-at-all-costs thing in my life.”

Not to put words into Rand’s mouth but it seems that what he’s saying is that it’s absolutely worthwhile to scale a business to a point where there’s a work-life balance that makes sense for a business owner and their “lifestyle.”

Case For Startups

Not everyone agreed that established brands would successfully transition from SEO tools to AI search, arguing that startups are not burdened by legacy SEO ideas and infrastructure, and are better positioned to create AI-native solutions that more accurately follow how users interact with AI chatbots and search.

Daniel Rodriguez, cofounder of Beewhisper, suggested that the next generation of winners may not be “better Conductors,” but rather companies that start from a completely different paradigm based on how AI users interact with information. His point of view suggests that legacy advantages may not be foundations for building strong AI search tools, but rather are more like anchors, creating a drag on forward advancement.

He commented:

“You’re 100% right that the incumbents’ advantages in crawling, data processing, and enterprise relationships are immense.

The one question this raises for me is: Are those advantages optimized for the right problem? All those strengths are about analyzing the static web – pages, links, and keywords.

But the new user journey is happening in a dynamic, conversational layer on top of the web. It’s a fundamentally different type of data that requires a new kind of engine.

My bet is that the 1-2 startups that break through won’t be the ones trying to build a better Conductor. They’ll be the ones who were unburdened by legacy and built a native solution for understanding these new conversational journeys from day one.”

Venture Capital’s Role In The AI SEO Boom

Mike Mallazzo, Ads + Agentic Commerce @ PayPal, questioned whether there’s a market to support multiple breakout startups and suggested that venture capital interest in AEO and GEO startups may not be rational. He believes that the market is there for modest, capital-efficient companies rather than fund-returning unicorns.

Mallazzo commented:

“I admire the hell out of you and SEMRush, Ahrefs, Moz, etc– but y’all are all a different breed imo– this is a space that is built for reasonably capital efficient, profitable, renegade pirate SaaS startups that don’t fit the Sand Hill hyper venture scale mold. Feels like some serious Silicon Valley naivete fueling this funding run….

Even if AI fully eats search, is the analytics layer going to be bigger than the one that formed in conventional SEO? Can more than 1-2 of these companies win big?”

New Kinds Of Search Behavior And Data?

Right now it feels like the industry is still figuring out what is necessary to track, what is important for AI visibility. For example, brand mentions is emerging as an important metric, but is it really? Will brand mentions put customers in the ecommerce checkout cart?

And then there’s the reality of zero click searches, the idea that AI Search significantly wipes out the consideration stage of the customer’s purchasing journey, the data is not there, it’s swallowed up in zero click searches. So if you’re going to talk about tracking user’s journey and optimizing for it, this is a piece of the data puzzle that needs to be solved.

Michael Bonfils, a 30-year search marketing veteran, raised these questions in a discussion about zero click searches and what to do to better survive it, saying: 

“This is, you know, we have a funnel, we all know which is the awareness consideration phase and the whole center and then finally the purchase stage. The consideration stage is the critical side of our funnel. We’re not getting the data. How are we going to get the data?

So who who is going to provide that? Is Google going to eventually provide that? Do they? Would they provide that? How would they provide that?

But that’s very important information that I need because I need to know what that conversation is about. I need to know what two people are talking about that I’m talking about …because my entire content strategy in the center of my funnel depends on that greatly.”

There’s a real question about what type of data these companies are providing to fill the gaps. The established platforms were built for the static web, keyword data, and backlink graphs. But the emerging reality of AI search is personalized and queryless. So, as Michael Bonfils suggested, the buyer journeys may occur entirely within AI interfaces, bypassing traditional SERPs altogether, which is the bread and butter of the established SEO tool companies.

AI SEO Tool Companies: Where Your Data Will Come From Next

If the future of search is not about search results and the attendant search query volumes but a dynamic dialogue, the kinds of data that matter and the systems that can interpret them will change. Will startups that specialize in tracking and interpreting conversational interactions become the dominant SEO tools? Companies like Conductor have a track record of expertly pivoting in response to industry needs, so how it will all shake out remains to be seen.

Read the original post on LinkedIn by Conductor CEO, Seth Besmertnik.

Featured Image by Shutterstock/Gorodenkoff

When Direct Means We Don’t Know: CMOs Need To Rethink Attribution In AI Search via @sejournal, @gregjarboe

I was asked recently to take a closer look at the data for a website in Google Analytics 4 (GA4).

This was for “Measurement Queen” Katie Delahaye Paine, a pioneer with over 30 years of experience in communications research and measurement, who now feels like she is flying blind.

From looking at her data in GA4, it turns out that 86% of the new users who visited her website over the last 28 days came from the “direct” channel.

That means the author of Measure What Matters can’t identify the sources of the vast majority of her website’s traffic.

So, I compared user acquisition for the last 28 days with the same period last year (matching the day of week). The good news was that total new users were up 29% year-over-year (YoY).

But here’s the bad news: Direct traffic to her site was up 126% YoY, while referral traffic was down 90%, organic social traffic was down 33%, and organic search traffic was down 28%.

This means that more than six out of seven users are now arriving on Paine’s site without a traceable referrer.

This includes situations where a user types her website address directly into their browser, uses a bookmark to access her site, or arrives from a source that doesn’t pass referrer information.

Digging Deeper Into What’s Behind The Traffic Surge

So, I asked the Measurement Queen a couple of standard questions:

She replied, “I don’t even have a TikTok account and haven’t used WhatsApp in years!”

I’d call that a big no. But it also indicated that I should use GA4’s search function to discover “top landing page by users for first user default channel group of direct traffic.”

The site’s homepage was the top landing page for direct traffic, but only 18.37% of users landed there. In second place was her blog, The Measurement Advisor, which got 13.96% of the site’s direct traffic.

When I shared this data with Paine, she revealed, “I’ve been blogging more frequently.”

I’d call that a big yes. So, I just asked Google about the titles of her recent blog posts in Google’s search box.

Here’s what I saw when I Googled [Sorry boss, I never got the Memo. How to know if you’re reaching the unreachables?].

Screenshot from search for [Sorry boss, I never got the Memo. How to know if you’re reaching the unreachables?], Google, June 2025

It’s worth noting that even when her content appears in a Google AI Overview, the link to her blog post doesn’t pass referrer data to GA4, and the link to her LinkedIn article on the same topic isn’t tracked by her GA4 account.

Then, I just asked Google, [Is Paine Publishing an authoritative site?].

Here’s what I saw:

Screenshot from search for [Is Paine Publishing an authoritative site?], Google, June 2025

So, even some of the direct traffic to her homepage may have come from links in AI Overviews that don’t pass referrer data to GA4.

Why haven’t similar insights been reported to more CMOs?

Reporting Squirrels, who primarily focus on generating reports without necessarily providing deep insights or actionable recommendations, are reluctant to highlight this type of anomaly, especially when “direct” means “We don’t know.”

So, CMOs need to rethink attribution in AI search. They need to independently verify and interpret GA4 event-based data.

And they also need to hire “Analysis Ninjas,” who excel at analyzing data to uncover hidden patterns, generate insights, and provide recommendations for business improvement.

Rethinking Attribution In AI Search

CMOs need to rethink their fundamental assumptions about attribution.

How should they attribute credit to key user actions throughout the customer’s journey toward making a purchase or completing other important actions on their sites?

They should avoid the old discussions that narrowly focused on data-driven attribution versus paid and organic last-click attribution.

Those touchpoints seem less meaningful when AI search is obscuring the sources of six out of seven of their website’s visitors.

Instead, CMOs (and important members of their team) should read “It’s Time for Marketers to Move Beyond the Linear Funnel,”

The article by the Boston Consulting Group cites force-fitting the complex array of touchpoints into a linear, funnel model doesn’t align with actual customer journeys.

This linear, funnel model can lead to missed opportunities due to poorly allocated resources or ineffective communication.

BCG says, “Marketers should instead adopt a more adaptable framework that more accurately reflects the real paths consumers take.”

BCG recommends shifting from the linear funnel to “influence maps.” But, before CMOs fly into that fog bank, they should re-examine the “expanding network of touchpoints – new streaming services, online shopping experiences, GenAI, and social platforms.”

Recognizing The Attribution Gaps That Existed Before AI

If CMOs blow up the funnel model and examine what’s in the awareness stage, they’ll see it includes radio, TV ads, magazines/newspapers, in-store announcements, word of mouth, packaging, and billboards. None of these were ever tracked in GA4.

And, if they analyze what’s in the consideration stage, they’ll see it includes video, brand sites, social media, search, sponsored content, retail media, in-app, and email. These were tracked by GA4 – until AI search started clouding over the sources of this traffic to websites.

In other words, GA4 didn’t track the awareness stage of this “multi-touchpoint landscape” even before the advent of Google AI Overviews.

And now that AI search is obscuring the sources of most of the touchpoints in the consideration stage, CMOs need to rapidly reconsider, review, revise, reassess, reconceptualize, and reimagine their assumptions about data-driven attribution.

These old assumptions may still be valid for Performance Max campaigns in Google Ads, which leverage Google’s AI to maximize performance across all of Google’s advertising channels, including Search, Display, YouTube, Discover, Gmail, and Maps.

And when an organization connects its Google Analytics property to a Google Ads account, it makes it possible to align GA4 and Google Ads conversions using the organization’s most important events.

But, according to a 2024 zero-click search study, paid search accounts for only 1% of clicks.

So, how do CMOs assign credit to SEO, content marketing, social media marketing, and communications for the 40.5% of other Google searches that produce clicks, or the 58.5% of zero-click searches?

Until Google provides a new version of Analytics that measures what matters for professionals across the entire marketing mix, CMOs will need to independently verify and interpret GA4’s event-based data.

Independently Verifying And Interpreting GA4 Event-Based Data

How do CMOs discover the critical data and strategic insights they need to successfully navigate through the fog bank surrounding the awareness stage of customer journeys?

They should conduct more old-school market research. Ironically, many brands cut their budgets for market research after Google started offering free brand lift studies to advertisers for their YouTube campaigns in March 2013.

But, CMOs don’t need to limit independent brand lift studies to asking questions about ad recall. They can ask questions about brand awareness, consideration, and purchase intent to understand the value of their entire marketing mix.

In 2019, my digital marketing agency helped the Rutgers School of Management and Labor Relations (SMLR) launch a new online master’s degree program.

We won the U.S. Search Award for Best Use of PR in a Search Campaign and were a finalist in the Best Integrated Campaign category.

We conducted pre- and post-launch surveys six months apart to show:

  • The percentage of respondents who said they were “familiar with” Rutgers SMLR had increased from 13.8% pre-launch to 18.5% post-launch.
  • The percentage of respondents who said they were “very likely” to recommend Rutgers SMLR to a friend or colleague had increased from 16.7% pre-launch to 19.0% post-launch.

Next, CMOs can successfully navigate through the low clouds now obscuring the touchpoints in the consideration stage by putting someone in charge of audience research as well as market research.

There are several excellent audience research tools, each with unique strengths, to help understand their needs, behaviors, preferences, and motivations.

For online behavior and digital footprints, SparkToro and Similarweb are highly effective.

For psychographic and cultural affinity analysis, Audiense and BuzzSumo are great choices.

For social listening and brand monitoring, Sprout Social and Keyhole are powerful options.

Taking Control When Analytics Falls Short

Next, CMOs should challenge their SEO, content marketing, social media marketing, and communications teams to create their own audiences in GA4 just like the ones that the paid media team is already using for remarketing campaigns.

For example, a PR audience could include users who:

  • Scroll to 90% of a blog post or article.
  • Download a whitepaper.
  • Play at least 50% of a product video.
  • Complete a tutorial.

The communications team can share their PR audiences with their colleagues in paid media, who can use Google Ads to remarket to these groups of users.

  • If users scroll to 90% or more of your blog post or download a whitepaper, then they can use ads to invite them to subscribe to your newsletter.
  • If users play at least 50% of a product video or complete a tutorial, then they can use ads to invite them to attend one or more in-person or virtual events.

CMOs should also ask their digital analytics teams if they have used “Explorations” this month. This is a set of advanced tools in GA4 designed to go beyond basic reports, allowing them to gain deeper insights into their customers’ behavior.

There’s no way to predict what different digital analytics teams will discover, but CMOs who feel they’re flying blind will want to know what their team saw when they used:

  • User Exploration to dig into data about individual users or groups within your segments to analyze detailed user journeys.
  • Cohort Exploration to study user groups with shared traits to understand behavior trends and performance over time.
  • Segment Overlap to compare how user segments intersect to uncover hidden audiences that meet specific conditions.
  • Funnel Exploration to track the steps users follow to complete key actions, helping you optimize conversion paths and spot performance issues.
  • Path Exploration to visualize the actual navigation paths users take through your website or app.
  • User Lifetime to assess long-term user behavior and value from the first visit through their customer lifecycle.

Hire Analysis Ninjas Who Excel At Analyzing Data

Finally, CMOs need to ask themselves: How did the attribution problem manage to fly under the radar for so long?

They could blame GA4’s Analytics Intelligence. Automated insights are supposed to detect unusual changes or emerging trends in their website’s data and notify their digital analytics team automatically, on the Insights dashboard, within the Analytics platform.

If the so-called Reporting Squirrels were reluctant to highlight this type of anomaly, especially when “direct” means “We don’t know,” then who is really to blame?

That’s why CMOs also need to ask themselves: How do I turn at least one of my Reporting Squirrels into an Analysis Ninja?

To encourage a Reporting Squirrel to evolve into an Analysis Ninja, CMOs must shift from asking for data to encouraging someone on their digital analytics team to actively interpret it and recommend solutions.

This also involves encouraging them to develop skills in statistical analysis, understand business context, and communicate findings effectively.

More Resources:


Featured Image: Viktoriia Hnatiuk/Shutterstock

How Enterprise Search And AI Intelligence Reveal Market Pulse

The last few years have fundamentally transformed how businesses and consumers discover, evaluate, and engage with brands.

What began as a digital acceleration in 2020-2021 has evolved into an AI-driven revolution that’s reshaping the entire search landscape in 2025 across every industry vertical.

Where organizations once relied on monthly snapshots and historical data, today’s market reality demands real-time AI intelligence with a 360-degree view across all platforms.

The traditional customer journey – whether B2B, B2C, or D2C – which used to span multiple sessions, site visits, and vendor comparisons, can now unfold in a single AI interaction.

When a decision-maker asks Google AI Overviews, ChatGPT, or Perplexity for the best HR software, skincare routine, or investment strategy, they’re no longer sifting through dozens of links.

AI immediately assembles a shortlist with commentary, pros and cons, and implicit recommendations.

AI Search Revolution: From Information Retrieval To Active Evaluation

Recent BrightEdge data reveals the magnitude of this shift: Impressions on all content have skyrocketed by over 49% since the launch of AI Overviews, while Google still maintains over 90% of market share.

However, the game has undergone a fundamental change. AI isn’t just retrieving information; it’s actively evaluating, framing, and recommending brands before prospects even click a link.

Consider the stark reality facing all marketers: Only 31% of AI-generated brand mentions are positive, and of those, just 20% include direct recommendations.

Source: BrightEdge, June 2025

This means that whether you’re marketing enterprise software, consumer products, or direct-to-consumer services, how your brand appears in AI results across Google AI Overviews, ChatGPT, and Perplexity varies dramatically depending on the AI model, its training data, and interpretive logic.

The growth trajectory tells the story:

  • ChatGPT: 21% growth in the last month.
  • Perplexity and Gemini: Remaining about one-tenth of ChatGPT’s size.
  • Claude, Meta, and Grok: Another one-tenth smaller than Perplexity and Gemini.

This isn’t just channel diversification; it’s a complete redefinition of discoverability where AI serves as both gatekeeper and advisor.

Being Aware Of What Is Going On In Your Broader Markets

Understanding The New Market Dynamics

Many marketers have traditionally taken an immediate and microscopic approach to SEO. Without thinking, the focus goes straight to the keyword and the link.

However, working across all market segments requires a shift in mindset towards understanding not just the business but the broader market and economic implications that may affect how you tailor your strategy.

Overall, market factors influence short-, mid-, and long-term strategies. Utilize models such as PEST analysis to understand what is going on in the market from a political, economic, social, and technological perspective:

  • Political: AI regulation, data privacy laws, elections, and new compliance requirements.
  • Economic: AI’s compression of decision cycles, changing sales velocities, and market volatility.
  • Social: Consumer behavior is shifting toward AI-assisted purchasing, altering the dynamics of brand trust.
  • Technological: AI model capabilities, real-time indexing, cross-platform optimization requirements.

The MAP Framework For AI Search Success

Modern marketing intelligence requires mastering three critical dimensions: Mention, Authority, and Performance – what I call the MAP Framework for AI search success.

This framework applies whether you’re marketing SaaS solutions, consumer electronics, fashion brands, financial services, or any product or service in today’s AI-influenced marketplace.

Mentions: Beyond Traditional Rankings

While Google still commands the foundation with over 90% market share, the ecosystem has diversified rapidly.

AI Overviews (AIOs) now appear in over 11% of Google queries – a 22% increase since debuting last year.

More significantly, longer, more complex queries have increased by 49% in AI Overviews since May 2024, specifically designed to support complex B2B decisions.

In contrast, ranking-style content and comparison queries have decreased by 60% and 14%, respectively.

BrightEdge data shows the industries with the strongest AI Overview presence are healthcare, education, B2B tech, and insurance. Travel and entertainment are on the rise, while ecommerce has not seen rapid growth in the past year.

Authority: When AI Forms Opinions About Your Brand

The most critical insight for all marketers is understanding how AI systems interpret and present brand information across every category.

Our research shows significant variation in how brands are portrayed across different AI platforms and industries:

  • Finance brands: Positive mentions align around regulatory compliance and security content.
  • Healthcare brands: Accuracy and credibility drive positive AI sentiment.
  • Technology brands: Innovation and reliability serve as primary AI evaluation criteria.
  • Consumer brands: Customer reviews, product quality, and brand reputation influence AI recommendations.
  • Retail/Ecommerce: Price competitiveness, product availability, and user experience drive AI mentions.
  • Professional services: Case studies, client success stories, and industry expertise shape AI perception.

Whether AI is evaluating enterprise software, consumer products, or professional services, it effectively writes the evaluation criteria and creates shortlists without brands having direct input, making perception management mission-critical across all verticals.

Performance: New Metrics That Matter

Traditional key performance indicators (KPIs), such as rankings, impressions, and traffic, aren’t disappearing, but they’re insufficient for AI-driven discovery.

While impressions on all content have skyrocketed by over 49% since the launch of AI Overviews, click-throughs have steadily declined, with a nearly 30% reduction since May 2024.

Yet, conversion rates remain strong, suggesting that AI successfully qualifies leads before they reach websites.

Essential AI Search Metrics:

  1. AI Mention Rate: Percentage of target queries where your brand appears in AI responses.
  2. Citation Authority: How consistently you’re cited as the primary source.
  3. Share of AI Conversation: Your semantic real estate in AI answers versus competitors.
  4. Prompt Effectiveness: How well your content answers natural language prompts.
  5. Response-to-Conversion Velocity: Speed at which AI-influenced prospects convert.

Monthly reporting cycles have become obsolete. AI-generated results can shift within hours based on content updates, prompt trends, or model training, demanding real-time monitoring capabilities.

Read more: How AI Is Changing The Way We Measure Success In Digital Advertising

Combining Business & Search Intelligence To Understand The Pulse Of The Customer

AI Intelligence With Comprehensive Market Insights

Modern marketing intelligence extends far beyond traditional keyword monitoring, requiring a 360-degree view across all consumer touchpoints and all key AI search engines.

Today’s successful organizations – whether B2B, B2C, or D2C – leverage AI to understand market pulse through multiple lenses:

Real-Time Consumer Intelligence

AI agents now research on behalf of consumers across all categories, from enterprise software to skincare products.

These agents analyze your brand through your digital presence, social proof, customer reviews, and competitive positioning.

They’re becoming sophisticated evaluation consultants that assess everything from product specifications to brand values.

Cross-Industry Predictive Modeling

Advanced business intelligence now incorporates AI behavior patterns to forecast demand shifts across all sectors.

When AI systems consistently recommend specific product categories, highlight particular brand attributes, or emphasize certain consumer benefits, these signals predict broader market movements – whether in B2B procurement, consumer purchasing, or direct-to-consumer trends.

Omni-Engine And LLM Sentiment Analysis

Different AI platforms treat content differently across all industries.

For consumer brands, ChatGPT might emphasize user reviews and social proof, while Perplexity focuses on expert analysis and technical specifications.

For B2B brands, LinkedIn-integrated AI may prioritize professional endorsements, whereas general AI platforms tend to emphasize case studies and return on investment (ROI) data.

Understanding these platform-specific nuances enables strategic content distribution across every marketing vertical.

From Search To AI As The Voice Of Every Customer

In many ways, AI is the voice of the customer across all industries.

Search queries contain intent signals, SERP analysis reveals how customers prefer to consume content, and keyword reports enable us to produce content that resonates – whether for enterprise buyers, individual consumers, or any audience in between.

However, especially in an agentic world, AI is not just forming opinions. It is taking actions for users. In shopping, it can actually make transactions for people.

Keeping a daily pulse on new insights impacting your market and on what is changing in AI responses daily should be of mandatory importance for those who want to benefit from fresh, new opportunities.

For example, a single result and opinion generated by AI in a search can significantly impact revenue in just one day.

During important seasons (especially in retail), subtle category-related demand shifts will require granular action.

New product launches require daily monitoring so stakeholders can see the daily impact and adjust accordingly, leveraging AI to automatically optimize the offering.

Utilizing Business Intelligence To Understand And Visualize The Pulse Of The Market

Real-Time AI Platform Monitoring

More than ever, organizations are seeking business intelligence (BI) to transform data into actionable insights that can be quickly leveraged across traditional search and every AI engine where customers discover solutions.

BI enables marketers to easily analyze insights for larger-than-usual data sets to uncover new opportunities and highlight campaign strategy inefficiencies.

Here is an example from my company:

Source: BrightEdge, June 2025

This type of intelligence can inform you about what is happening now and what has happened in the past across all discovery channels.

Many types of business intelligence can help deliver digestible snapshots of the current state of your market, not just for SEO but also for digital, sales, product, and customer service functions.

Entity-Based SEO For AI Discovery Across All Verticals

Move beyond keywords to comprehensive topic authority, regardless of your industry.

AI prioritizes content from known, trusted entities, making authoritative content three times more likely to be cited in AI responses across B2B software, consumer electronics, fashion, healthcare, financial services, and every other vertical.

Implement robust schema markup, ensure consistent entity references across all digital properties, and build connections with recognized authorities in your space – whether that’s industry analysts, consumer advocates, or subject matter experts.

360-Degree AI Platform Strategy

Success requires presence and optimization across traditional search and every AI engine where your customers might discover solutions. This means:

  • Google Search & AI Overviews: Still the foundation with 90%+ market share.
  • ChatGPT: 21% growth rate, emphasis on conversational discovery.
  • Perplexity: Research-heavy platform with strong citation emphasis.
  • Vertical-specific AI: Industry tools, shopping assistants, and specialized platforms.
  • Social AI Integration: AI features within LinkedIn, TikTok, Instagram, and other social platforms.
  • Voice & Mobile AI: Alexa, Siri, Google Assistant across devices.

Consumer Intelligence Integration

Traditional search data must be combined with the following:

  • Social listening across AI-integrated platforms.
  • Review and rating sentiment from AI-crawled sources.
  • Purchase behavior data as it relates to AI recommendations.
  • Cross-platform brand mention analysis.
  • Consumer journey mapping across AI touchpoints.
  • Competitive intelligence from AI responses.

This approach reveals not just what consumers search for but how AI interprets and presents your brand across every possible discovery moment.

Mobile Vs. Desktop AI Optimization

Mobile and desktop AI Overviews aren’t just different sizes. They’re fundamentally different products targeting distinct user behaviors.

According to BrightEdge Generative Parser data from May and June 2025, these platforms serve different user intents and require tailored optimization strategies.

Key Mobile Vs. Desktop Differences:

Mobile Opportunities:

  • Ecommerce AIOs appear three times more often (13.5% vs 4.5% on desktop).
  • Mobile shows more size variability, suggesting Google is actively experimenting with format and content.
  • Users are in discovery/shopping mode, making mobile ideal for product research and comparison.

Desktop Patterns:

  • Takes 80% more screen space than mobile (1110 px vs. 617 px).
  • AIOs appear 39% more frequently than mobile.
  • More consistent, predictable sizing patterns.
  • Users want detailed, comprehensive information delivery.

As Jim Yu, CEO of BrightEdge, notes: “If marketers are not paying attention to how AI operates on different devices, they may be missing some key opportunities, especially in ecommerce!”

Read more: Newly Released Data Shows Desktop AI Search Referrals Dominate

Strategic Implications:

  • Mobile users require discovery-focused, shopping-oriented content optimization.
  • Desktop users need comprehensive, detailed information architectures.
  • Ecommerce brands must prioritize mobile-first AIO strategies.
  • Content strategy should consider device context alongside traditional keyword targeting.
  • Search marketers must ensure teams optimize for both user experiences simultaneously.

Vertical-Specific AI Optimization

Industry-specialized AI models are emerging for cybersecurity, manufacturing, fintech, and healthcare.

Content strategies must account for domain-specific AI companions that understand industry nuance and evaluate solutions using sector-appropriate criteria.

This can be visualized via daily dashboards, visualizations, and custom-based reports, and can be used to:

  1. Analyze industry trends in real-time across all AI platforms.
  2. Visualize category demand and inventory in real time.
  3. Compare historical data with current trends across traditional and AI search.
  4. Create and forecast based on predictive modeling that includes AI behavior patterns.
  5. Aggregate different sources of data from search engines and AI platforms.
  6. Identify new buyer trends across all customer segments.
  7. Monitor brand presence, perception, and performance.
  8. Find inefficiencies in product or pricing strategy based on AI recommendations.
  9. Identify key correlations between search activity and mentions of AI platforms.
  10. Plan across all discovery channels and map content to key AI touchpoints.
  11. Evaluate marketing campaign effectiveness across traditional and AI-driven channels.

Conclusion

Success in 2025’s marketing landscape requires understanding that AI isn’t just a channel. It’s becoming the primary interface between your brand and potential customers across every industry and buying scenario.

The organizations that master the MAP Framework (Mention, Authority, and Performance) while maintaining a 360-degree view across traditional search, AI engines, and consumer intelligence will be the ones AI recommends when it matters most.

The shift from traditional search to AI-powered discovery isn’t coming – it’s here.

Marketers across B2B, B2C, and D2C who embrace comprehensive AI intelligence tools, implement real-time monitoring across all platforms, and optimize for AI evaluation criteria will capture market opportunities.

In this new reality, staying attuned to the market means understanding not only what customers search for but also how AI interprets, evaluates, and presents your brand across every possible touchpoint.

The future belongs to brands that learn to collaborate with AI, guide its understanding across all platforms, and position themselves to stand out in an era where artificial intelligence often makes the first – and sometimes, final – impression, whether someone is buying enterprise software, choosing a restaurant, or selecting a healthcare provider.

Unless otherwise indicated, any data mentioned above was taken from this BrightEdge study

More Resources:


Featured Image: innni/Shutterstock

Microsoft Clarity Announces Natural Language Access To Analytics via @sejournal, @martinibuster

Microsoft Clarity announced their new Model Context Protocol (MCP) server which enables developers, AI users and SEOs to query Clarity Analytics data with natural language prompts via AI.

The announcement listed the following ways users can access and interact with the data using MCP:

  • Query analytics data with natural prompts
  • Filter by dimensions like Browser, OS, Country/Region, or Device
  • Retrieve key metrics: Scroll Depth, Engagement Time, Total Traffic, etc.
  • Integrates with Claude for Desktop for AI-powered querying

MCP Server is a software package that needs to be installed and run on a server or a local machine where Node.js 16+ is supported. It’s a Node.js-based server that acts as a bridge between AI tools (like Claude) and Clarity analytics data.

This is a new way to interact with data using natural language, where a user tells the AI client what analytics metric they want to see and for what period of time and the AI interface pulls the data from Microsoft Clarity and displays it.

Micrsoft’s announcement says that this is the beginning of what is possible, sharing that they are encouraging feedback from users about features and improvements they’d like to see.

The current road map of features listed for the future:

“Higher API Limits: Increased daily limits for the Clarity data export API

Predictive Heatmaps: Predict engagement heatmaps by providing an image or a url

Deeper AI integration: Heatmap insights and more given the context

Multi-project support: for enterprise analytics teams

Ecosystem – Support more AI Agents and collaborate with more MCP servers “

Read Microsoft’s announcement:

Introducing the Microsoft Clarity MCP Server: A Smarter Way to Fetch Analytics with AI

Featured Image by Shutterstock/Net Vector

Data Clean Room: What It Is & Why It Matters In A Cookieless World via @sejournal, @iambenwood

In recent years, the digital marketing landscape has experienced significant shifts, particularly concerning user privacy and data tracking mechanisms.

Notably, Google’s initial plan to phase out third-party cookies in Chrome by 2022 was reversed in July 2024, allowing their continued use.

This reversal has implications for data clean rooms, which were poised to become essential tools in a cookieless world.

However, the persistence of third-party cookies does not diminish the growing challenges associated with signal loss.

Users are increasingly encountering cookie consent pop-ups and more prominent privacy notices across websites and apps, which is reducing the availability of data for marketers.

This heightened user awareness and control over personal data necessitate reevaluating data collection and analysis strategies.​

Data clean rooms remain vital in this context. They offer a privacy-compliant environment where multiple parties can collaborate on data without exposing personally identifiable information.

They also enable advertisers and publishers to perform advanced analytics on combined datasets, extracting valuable insights while adhering to privacy regulations.

What Is A Data Clean Room?

A data clean room is a piece of software that enables advertisers and brands to match user-level data without actually sharing any PII/raw data with one another.

Major advertising platforms like Facebook, Amazon, and Google use data clean rooms to provide advertisers with matched data on the performance of their ads on their platforms.

Data clean room visualization.Image from author, March 2025

All data clean rooms have extremely strict privacy controls, and businesses are not allowed to view or pull any customer-level data.

Modern data clean rooms have evolved to facilitate more streamlined and secure data collaboration.

They allow brands and publishers to combine datasets without exposing raw data, adhering to stringent privacy regulations.

This advancement addresses the challenges posed by increased data fragmentation and the heightened emphasis on user privacy.

The benefit to advertisers is a much clearer picture of advertising performance within each platform.

But, it does rely on a solid bank of first-party data in the first place in order to run any significant matching with platform data.

For example, Google’s Ads Data Hub allows you to analyze paid media performance and upload your own first-party data to Google. This allows you to segment your own audiences, analyze reach and frequency, and test different attribution models.

There’s one major issue with this approach.

Although many platforms claim to be able to offer a cross-channel clean room solution, it’s hard to see how this would be the case given the strict privacy controls in place by Google and other platforms.

This is fine if a brand wants to increase spend within each platform, but it still creates a challenge in cross-network attribution.

An Example: Google Ads Data Hub

Google’s Ads Data Hub is expected to be a future-proof solution for Google-specific advertising (Search, Display, YouTube, Shopping) measurement, campaign insights, and audience activation.

Ads Data Hub is most effective when running multiple Google platforms, and if you have a substantial amount of first-party data to bring to the party (e.g., CRM data).

Google ads data hub.Screenshot from Ads Data Hub, Developers.google.com, March 2025

Ads Data Hub is essentially an API. It links two BigQuery projects – your own and Google’s.

The Google project stores log data you can’t get elsewhere because of GDPR rules.

The other project should store all of your marketing performance data (online and offline) from Google Analytics, CRM, or other offline sources.

Data Clean Room Challenges And Limitations

First-party data (the kind used to power data clean rooms) comes with fewer headaches around complying with privacy regulations and managing user consent.

But, first-party data is also much harder to get than third-party cookie data.

This means that the “walled gardens” such as Google, Facebook, and Amazon, which have access to the largest bank of customer data, will benefit from being able to provide advertisers with enhanced measurement solutions.

Also, brands that have access to lots of consumer data – e.g., direct-to-consumer brands – would gain a marketing advantage over brands that have no direct relationships with consumers.

Most data clean rooms today only work for a single platform (e.g., Google or Facebook) and cannot be combined with other data clean rooms.

If you advertise across multiple platforms, you will find this limiting since you cannot join the data to build a full view of the customer journey without manually stitching the insights together.

Before marketers dive into a specific clean room platform, the first consideration should be how much of your ad spend is focused on each network.

For example, if the majority of digital spend is focused on Facebook or other non-Google platforms, then it’s probably not worth investing in exploring Google Ads Data Hub.

Alternatives To Data Clean Rooms

Data clean rooms are just one way of overcoming the challenges we face with the loss of third-party cookies, but there are other solutions.

Two other notable alternatives being discussed right now are:

Browser-Based Tracking

Google claims its Federated Learning of Cohorts (FLoC) inside Chrome is 95% as effective as third-party cookies for ad targeting and measurement.

Essentially, this will hide users’ identities in large, anonymous groups, which many are skeptical about.

To be clear, FLoCs aren’t clean rooms – but they do anonymize user-level data and cluster audiences based on shared attributes.

Universal IDs

Universal user IDs are an alternative to the browser-based tracking option presented in Google’s privacy sandbox.

These would be used across all major ad platforms but anonymized so advertisers wouldn’t see a person’s email address or personal data.

In theory, universal IDs would make cross-network attribution easier for advertisers, as the universal ID tag would effectively replicate the functionality of third-party cookies.

What Will The Future Hold?

Tracking and reporting are no longer background tasks that we used to take for granted; they now require explicit user consent.

This transition requires companies to ask users for their consent to give up their data more often.

It requires users to click through more obtrusive privacy pop-ups. It will probably create more friction for users, at least in the short term, but this is the trade-off for a free and open web.

Beyond the “walled gardens” such as Google, some companies are working to build omnichannel data clean rooms.

These secure environments facilitate collaborative data analysis, enabling marketers to derive actionable insights without compromising user privacy.​

In summary

Data clean rooms have become indispensable in navigating the complexities of modern digital marketing.

Their ability to enable secure, privacy-compliant data collaboration positions them as crucial tools in addressing the challenges of data fragmentation and stringent privacy regulations.

While this would certainly help with the challenge of cross-platform attribution, there will likely be a mismatch between the data provided between different ad platforms that will require manual interpretation.

Regardless of the “clean room” technology that will enable this data matching, there is a need to invest in building up your own first-party data now to enable any cross-referencing of data with advertising platforms or ad tech providers.

This requires creating and trading value for deep data on your customers.

More Resources:


Featured Image: Gorodenkoff/Shutterstock

How To Create A Marketing Measurement Plan For Accurate Data & Strategic Alignment via @sejournal, @torylynne

Tracking marketing performance effectively comes down to three key factors:

  • Defining the pipelines, audiences, events, and metrics that truly matter to your business.
  • Ensuring each element is measured with precision.
  • Aligning your team around the data points that drive the most impact.

When these pieces come together, you gain the clarity to track progress, scale insights, and make informed decisions with confidence.

But, how do you get there?

That’s where a marketing measurement plan comes in. This framework acts as a blueprint, outlining the critical components that keep your marketing data and analytics running smoothly.

It helps align stakeholders at every level – whether channel managers, developers, or leadership – so that everyone is working from the same playbook.

Most importantly, it keeps strategy and success metrics anchored to a common goal.

Let’s dive into the key elements and start building one for your business.

The Marketing Measurement Plan In A Nutshell

What Is It?

It is a map of individual inputs for accurate reporting that informs meaningful business insights.

What Does It Do?

It documents the business-critical measurements needed to track the results of a marketing plan and the high-level technical requirements that make it possible.

It doesn’t set benchmarks or goals. Rather, it’s the documentation of the “what” and “how.”

Why Is It Valuable?

1. It Clarifies Reporting Needs For Stakeholders Handling Implementation

Know exactly what’s needed to support the team because it’s all “right there.”

Ideally, stakeholders have played a role in mapping out the measurement model, so they’ll have no problem taking it from ideation to implementation.

2. Tracking Gaps Are Caught Before They Become Problems

There’s nothing quite as disheartening as getting to the end of a campaign and finding critical metrics missing from reporting.

The marketing measurement plan gathers inputs from – and is reviewed by – multiple stakeholders across the team. So, there’s less likelihood of discovering gaps down the road.

3. Creating A Marketing Measurement Plan Breaks Down Silos By Nature

It requires cross-channel and cross-functional input. Then, all of that input gets factored into prioritization at the highest level, documented in a language everyone can speak.

4. It Defines What Matters Most For Strategic Alignment

Is it more important to prioritize traffic or a specific conversion type based on business objectives?

You can see how even just that one important clarification makes a world of difference in strategy at the channel level.

For example, if the answer is conversion, SEO professionals would likely prioritize work specific to product pages over blog URLs in their roadmap.

5. It’s A Helpful Reference For Future Tracking Implementations

If and when new tracking is required, there’s a place to document any additions over time and ensure the tracking doesn’t already exist.

Plus, the implementation team can see everything else that’s already in place, so nothing gets broken in the process.

10 Questions Behind A Marketing Measurement Plan

A marketing measurement plan includes three distinct sections:

  • Technical Requirements.
  • Events & Audiences.
  • Implementation Requirements.

Tech Requirements

Cars can’t go anywhere without roads. Similarly, there needs to be a path for data to travel to the team. You need to map the key data sources, where they intersect, and where all of that data collects.

That’s a matter of answering a couple of questions, which will likely require input from the dev team.

What’s Our Front-End Tech Stack?

Implementing the analytics pipeline looks different depending on what your site uses to serve content.

In some cases, it’s actually multiple platforms, which means there’s additional work on each of them to get data into the same pool.

The Wappalyzer extension is an easy way to look under the hood and see the different platforms in play.

Just remember, it’s giving you information specific to the page rather than the whole site.

So, if you’re looking at a product page that’s served via Shopify, but the blog is built on WordPress, you wouldn’t catch that from the one page.

Screenshot from Wappalyzer extension for Chrome, February 2025Screenshot from Wappalyzer extension for Chrome, February 2025

Alternatively, if you have access to Sitebulb, you can crawl the site with the Parse Technologies setting enabled.

This will give you a list of technologies used across the site, rather than just testing one page.

Screenshot from Sitebulb Performance & Mobile Friendly Crawler Settings, February 2025Screenshot from Sitebulb Performance & Mobile Friendly Crawler Settings, February 2025

When it comes down to it, the best route is to sync with developers, who’ll be able to break down the purpose of each platform.

You’ll want to make sure that the measurement plan includes:

  • Front-end JavaScript framework (Vue, React, etc.).
  • Framework-specific plug-ins.
  • WYSIWYG landing page builders for marketing.
  • Platforms for content creation.

Where Do Our Users Come From?

Traffic comes from many places: email, organic search, PPC ads, affiliate articles, etc. The traffic behaves differently based on the source because each source plays a slightly different role in the marketing strategy.

Additionally, each source is made up of different referrers, but not all of those referrers will matter to every business.

For example, a B2B SaaS company probably cares more about LinkedIn than Instagram, whereas the opposite is likely true for an ecommerce brand.

Both sources and referrers need to be mapped for implementation to ensure the audiences are available in reporting.

Mapping source to referrers using social media as an exampleMapping source to referrers using social media as an example (Image from author, February 2025)

The measurement plan should include the following:

  • Direct traffic.
  • Organic traffic.
  • Paid search.
  • Display ads.
  • Social media (paid and organic).
  • Email.
  • Referral (earned links from external websites and media).
  • Affiliate (links from PR, Share-a-Sale, paid placements, etc.).
  • Other channels you care about (e.g., programmatic, voice if you have an Alexa skill, etc.).

Events & Audiences

The crux of effective marketing is understanding the behavior of the audience.

Which users are most likely to convert? Which behaviors show that users are moving closer to converting? Which promotions are most effective for which types of users?

We can answer these questions by mapping behavior to the marketing funnel, allowing us to understand where different actions fit within the customer journey.

In turn, this helps marketers make the right “ask” of users at the right moment.

A visualization of the marketing funnelA visualization of the marketing funnel (Image from author, February 2025)

For example, users coming from a link in an affiliate article are probably less ready to purchase than users who click through an email CTA.

But, they could be willing to exchange their email address for a discount or resource, which would lead them into email, where users are more likely to convert.

To validate that assumption or extract insights, we need the right data. But first, we need to define what the right data is by identifying meaningful behaviors worth tracking.

What’s The Primary Action We Want The User To Take?

Every business has a desired end-point to the digital marketing funnel, a.k.a. a conversion.

The user action considered a conversion differs based on the objectives of the business.

A blog site will want users to subscribe, whereas an ecommerce company will hope to drive a purchase, and B2B SaaS marketing aims to drive qualified leads for the sales team.

The measurement plan should identify the user behavior that represents a conversion, which could include:

  • Transaction.
  • Request demo.
  • Subscription.
  • Start a free trial.

What Do Users Do As They Move Down The Funnel?

No one has a 100% conversion rate. The customer journey is made of multiple touchpoints and is not always linear.

To understand those touchpoints, marketers need to define the “micro-conversions” on the path to conversion, i.e., identify the smaller behaviors that users who convert exhibit along the way, and how close those actions are to a conversion versus one another.

Visualizing where micro-conversions fit in the marketing funnelVisualizing where micro-conversions fit in the marketing funnel (Image from author, February 2025)

The next section in your marketing plan should list micro-conversions within your customer funnel, including but not limited to:

  • Add a product to cart.
  • Sign up for email.
  • Share onsite content.
  • Download a sales or solution sheet.
  • Initiate a chat.
  • Engage with specific content (ratings/reviews, FAQs, etc.).

How Do We Know When A User Is Engaged?

Google Analytics 4 has an engagement rate metric, but it’s really just the inverse of bounce rate.

The problem with that: Just because a user didn’t bounce, it doesn’t mean they’re engaged per se. Couple that with the increase in the use of cookie banners, and you can see why it’s not the most telling metric.

The measurement plan is an opportunity to define custom measures of engagement that create a more rich, accurate understanding.

For example, users who toggle product configurations on the product page might be more likely to convert than those who simply visit a product page. But, if that micro-conversion isn’t tracked, that insight would go by the wayside.

The measurement plan documents custom engagements (of which there can be many), including any relevant items from this list of common events:

  • Start a form.
  • Toggle product configurations.
  • View product images in carousel.
  • Log into account.
  • View a video.

Which Patterns Can We Use To Identify Valuable Groups Of Users?

Within the audience of people who visit your site, different segments will share different behaviors.

Some will be more valuable from a conversion standpoint, or may need unique pathing down the funnel.

To identify those segments and tailor marketing to their needs, we first have to map audiences to specific behaviors.

GA4 has some basic segments built in, such as audience by traffic source. However, creating your own audiences lends itself to more telling insights.

You can group users based on any number of conditions working together, allowing you to narrow the scope further.

In your measurement plan, focus on combinations of behavior that lend themselves to a deeper level of understanding. Here are some examples:

  • Group purchasers by the number of site visits before purchase.
  • Group engaged users by first session source.
  • Group users by intent based on landing-page category.

Implementation Requirements

We’ve gathered information about how our site works and what we want to measure. Now, it’s time to lay out the details of implementing analytics and reporting functionality.

This final section of the measurement plan covers requirements like the platforms to use and the specific parameters that make it possible to track events.

With that said, it’s generally a good section for the data/analytics team to own.

Which Analytics Platforms Should We Use?

Collecting data is one thing. For that data to be useful for marketing & analytics stakeholders, they need to be able to access, manage, and share it.

Otherwise, they can’t dig in for insights or report performance to the team.

That’s where the analytics solution comes in. The most well-known is GA4, though alternative platforms like Heap and Matomo are also available.

Then, another layer down are complementary tools for more specific types of data, including tools for A/B testing, heat mapping, etc. They generally depend on the API of the primary analytics solution.

In the measurement plan, make sure to document:

  • The primary analytics solution (GA4, Heap, Matomo, etc.).
  • Supplementary analytics tools (CrazyEgg, Hotjar, Optimizely, etc.).

How Will We Create Dashboards For Other Stakeholders?

A business can’t expect every team member who benefits from reporting to run their own reports. Plus, that would get expensive quickly! Shared dashboards are essential for keeping everyone informed and streamlining the process.

A data visualization tool like Looker Studio lets marketing and analytics stakeholders create self-updating reporting with the most relevant measurements.

Add the following to your measurement plan: Dashboarding tools (Google Data Studio, Microsoft Power BI, etc.)

What’s Our Tag Management System?

The answer to this question is most commonly Google Tag Manager, but it’s still worth taking a moment to unpack tags at a high level. Plus, it’s worth noting that there are some alternatives to Google Tag Manager.

Tags are the code and fragments that make measurement possible. Using a tag manager, analysts can easily create tags and define trigger events.

Tags, triggers, and variables make up a container, which is usually implemented in collaboration with the dev team.

While a tag manager is optional, it’s extremely valuable for the safe, swift deployment of analytics changes and updates.

So, one more item for your document: Tag management system

How Do We Enable Custom Events?

We chatted about custom events earlier. Now, we need to map out the parameters that make it possible to capture those events in the analytics solution.

While GA4 has some default events available upon implementation, Heap and Matomo require “data chefs” to cook from scratch.

Either way, a business will inevitably have unique reporting needs that require customization, regardless of which analytics solution it uses.

Custom measures are set up in the tag manager and might require some configuration to get the right data output. That looks different from platform to platform.

List custom event parameters tailored to the specific requirements of the analytics solution, based on the documentation below:

Accurate Data + Strategic Alignment = Growth

A marketing measurement plan isn’t just a map for creating an analytics proficiency; it’s also a tool that can help make existing analytics more proficient.

In either case, it’s an opportunity to create alignment around what really matters and accurate reporting that works hard for everyone.

It’s time to create one for your business, following the steps above, with help from the right stakeholders.

Special thanks to Sam Torres, chief digital officer at Gray Dot Company and speaker at BrightonSEO, for her extensive contribution to this article. Her deep expertise in data strategy and digital marketing ensures the accuracy and relevance of the insights shared here.

More Resources:


Featured Image: theromb/Shutterstock

Digital Ads Cost 19% More, Convert Less: User Frustration To Blame via @sejournal, @MattGSouthern

New data shows what many marketers already suspect: it’s getting harder and more expensive to convert online visitors.

A study of 90 billion sessions shows organic traffic is down from last year, pushing more brands toward paid channels to make up the difference.

This information comes from Contentsquare’s Digital Experience Benchmark Report, which examines changes in traffic patterns and highlights growing user frustrations.

Key Trends Shaping Today’s Digital Experience

1. Increasing Traffic Costs

Global website traffic dropped by 3.3% year-over-year (YoY), forcing brands to depend more on paid ads.

Paid sources now account for 39% of all traffic, a 5.6% increase. Organic and direct traffic fell by 5.7%.

With digital ad spending rising by 13.2%, the average cost per visit increased by 9% compared to last year and by 19% over two years.

2. New Visitors Leave Quickly

User engagement metrics are declining globally, with overall consumption (like time spent, page views, and scroll depth) falling by 6.5%.

New visitors viewed 1.8% fewer pages YoY, while returning visitors had a slight increase (+0.5%).

Most sessions that started on product detail pages (PDPs) ended immediately, underscoring the risk of overly transactional landing pages.

3. Frustration Hurts Retention

“Rage” clicks (clicking a page element at least three times in less than 2 seconds) and slow load times affected one in three visits and reduced session depth by 6%.

Sites that addressed these frustrations had 18% higher retention rates than their competitors.

4. Conversion Rates Decline

Global conversion rates fell by 6.1%, worsened by the lower yield of paid traffic (1.83% compared to 2.66% for unpaid traffic).

High-performing brands countered this trend by enhancing engagement: sites that improved session depth saw a 5.4% rise in conversions, while others faced a 13.1% drop.

5. Retention Starts On-Site

Despite a 7% YoY drop in 30-day retention, returning visits grew by 1.9%, driven by paid ads (+5.6%YoY).

Sites with strong retention had 17% fewer rage clicks and 18% more page views per visit, showing that smooth experiences lead to customer loyalty.

What This Means For Marketers

Here are some actionable insights for digital teams:

  • Diversify Traffic Strategies: Explore new channels, like retail media networks, to reduce dependence on unstable paid ads.
  • Improve New Visitor Journeys: Use heatmaps and personalized content to lower early exits.
  • Address Frustration Proactively: Implement real-time monitoring to tackle rage clicks and slow load times.
  • Leverage Analytics: Use behavioral data to identify high-intent visitors and improve their pathways.

Methodology

Contentsquare’s report analyzed 90 billion sessions, 389 billion page views, and 6,000 global websites from Q4 2023 to Q4 2024. The metrics covered various sectors, including retail, travel, and financial services.


Featured Image: robuart/Shutterstock

Insights From IAB’s Cross-Channel Measurement For Marketers Release via @sejournal, @gregjarboe

In the digital era, consumers interact with brands through a range of platforms and devices — such as social media, display ads, and video on mobile, desktop, tablet, and connected TV (CTV).

This diversity in touchpoints creates both opportunities and complexities for marketers. To navigate this landscape effectively, a robust measurement strategy is essential.

This morning, IAB released two new guides: “Implementing Cross-Channel Measurement for Marketers Playbook” and “Cross-Channel Measurement Best Practices for Marketers.”

The resources from IAB offer marketers detailed strategies for enhancing cross-channel measurement to achieve better business results.

From these guides, let me share some of the strategic insights and tactical advice that they offer marketers.

Implementing Cross-Channel Measurement For Marketers Playbook

The IAB’s “Implementing Cross-Channel Measurement for Marketers Playbook” provides a step-by-step approach to implementing cross-channel measurement for successful outcomes.

This guide lays out a comprehensive approach to building a unified measurement strategy, from setting goals and key performance indicators (KPIs) to using advanced attribution and ensuring privacy compliance.

It stresses the importance of regular audits and team collaboration, enabling marketers to keep up with industry trends and improve measurement tactics continually.

By following these steps, marketers can address common challenges, gain a comprehensive understanding of their marketing activities, and improve business results.

An effective cross-channel measurement strategy unifies campaign insights, allowing marketers to see how different channels contribute to success.

Integrating data from various sources offers a holistic view of consumer behavior, enables media budget optimization, and enhances customer experiences.

However, setting up a successful cross-channel measurement approach requires careful planning, diverse tool integration, and a commitment to continuous improvement.

By sidestepping common mistakes and following best practices, marketers can maximize media efficiency, elevate customer experiences, and improve business outcomes.

Focusing on continuous improvement through regular audits, active stakeholder involvement, and adapting to industry trends is essential for sustained success in an ever-changing digital environment.

Key points from the playbook include:

  • Setting Clear Objectives and KPIs: Defining SMART (specific, measurable, attainable, relevant, and time-bound) goals and KPIs is fundamental for alignment and clarity in measurement strategies. It’s also critical that these metrics align with strategic decisions – whether targeting audiences, gathering consumer insights, crafting messaging, or designing campaign approaches.
  • Developing a Unified Data Strategy: Achieving a holistic view of customer interactions across channels depends on making data interoperable and ensuring its quality. ETL (extract, transform, and load) processes allow integration from multiple sources. Beyond bringing data together, accessibility and seamless connectivity are essential for deep insights and well-informed decision-making.
  • Implementing Advanced Analytics and Attribution Models: Selecting suitable attribution models, employing predictive analytics, and using machine learning help marketers accurately assess the impact of each channel and refine their strategies.
  • Ensuring Privacy Compliance and Data Integrity: Adherence to privacy laws like GDPR and CCPA, implementing consent management systems, and maintaining data accuracy are key to protecting user privacy and ensuring data reliability.
  • Fostering Continuous Improvement and Collaboration: Regular data audits, setting performance benchmarks, engaging stakeholders, promoting team collaboration, and adapting to industry trends are vital for the ongoing refinement and effectiveness of cross-channel measurement strategies.

Cross-Channel Measurement Best Practices for Marketers

This resource explores the challenges of today’s complex digital advertising environment, offering practical advice on data integration, attribution, advanced analytics, privacy compliance, and ongoing optimization.

Digital advertising is increasingly complex as consumers engage with brands across a variety of channels and devices.

These touchpoints include direct media buys, social media, and programmatic campaigns across desktop, mobile web, mobile apps, and connected TVs, among others. This calls for a comprehensive measurement approach to achieve a unified view of marketing performance across all channels.

Cross-channel measurement is not only a technical necessity but also a strategic priority.

Marketers who excel at it harvest insights into their campaigns’ overall impact, optimize media spending, and enhance customer experiences.

A unified view of consumer interactions allows for data-driven decision-making, leading to higher ROI, better conversion rates, and stronger brand loyalty.

However, achieving this unified perspective presents challenges. Data silos, complex attribution, technological limitations, and privacy regulations can all impede effective measurement.

This guide offers marketers practical insights and best practices to overcome these obstacles, laying the groundwork for a successful cross-channel measurement strategy in today’s dynamic digital environment.

Why Cross-Channel Measurement Matters For Brand Advertisers And Agencies

Cross-channel measurement is essential for brand advertisers and agencies for several reasons:

  • Comprehensive Understanding of the Consumer Journey: It reveals how different touchpoints drive advertising success, enabling marketers to see the entire customer journey and understand how each interaction affects conversions.
  • Effective Budget Allocation: By identifying the most impactful channels, advertisers can allocate budgets more effectively, ensuring investments are directed toward channels with the highest ROI.
  • Refined Creative Strategies: Cross-channel insights allow marketers to improve creative strategies and messaging. By assessing content performance across platforms, they can tailor messaging to resonate better with target audiences.
  • Quantifying Marketing Impact: Overcoming data silos and using advanced attribution models helps advertisers quantify the true impact of their efforts, providing clear ROI evidence and justifying media spending.
  • Privacy Compliance and Trust: In a privacy-focused world, adhering to data regulations through rigorous practices builds consumer trust and protects brand reputation.
  • Informed Decision-Making: Effective cross-channel measurement empowers advertisers to make data-driven decisions, leading to more successful strategies, stronger brand loyalty, and better business results.

Why Cross-Channel Measurement Matters For Publishers And Platforms

For publishers and platforms, cross-channel measurement is crucial for these reasons:

  • Showcasing Value to Advertisers: It provides detailed performance data to show how your channels contribute to campaign success, making inventory more appealing and building trust-based relationships with buyers.
  • Boosting Revenue Growth: By highlighting the effectiveness of your media inventory through cross-channel insights, you can drive revenue growth, as advertisers are likely to invest in high-performing channels.
  • Optimizing Content and Ad Delivery: Insights into cross-channel interactions allow for refined content and ad strategies, enhancing user engagement and maximizing ad effectiveness to better meet market demands.
  • Identifying High-Performing Content: With accurate attribution and analytics, publishers can identify top-performing content formats, enabling them to adjust and optimize offerings in line with audience preferences and market trends.
  • Ensuring Privacy Compliance: Strong privacy practices protect user data – maintaining platform reputation – and ensure adherence to regulatory requirements.
  • Staying Competitive: In a data-driven market, effective cross-channel measurement enables publishers to remain competitive, fostering innovation and continuous improvement to deliver exceptional value to advertisers and audiences.

These are some of the strategic insights and tactical advice that I gleaned during my first dive into the guides.

Marketers will want to dive even deeper themselves. To do that, both of IAB’s new resources can be found here.

More resources:


Featured Image: Visual Generation/Shutterstock

Google Struggles To Boost Search Traffic On Its iPhone Apps via @sejournal, @MattGSouthern

According to a report by The Information, Google is working to reduce its reliance on Apple’s Safari browser, but progress has been slower than anticipated.

As Google awaits a ruling on the U.S. Department of Justice’s antitrust lawsuit, its arrangement with Apple is threatened.

The current agreement, which makes Google the default search engine on Safari for iPhones, could be in jeopardy if the judge rules against Google.

To mitigate this risk, Google encourages iPhone users to switch to its Google Search or Chrome apps for browsing. However, these efforts have yielded limited success.

Modest Gains In App Adoption

Over the past five years, Google has increased the percentage of iPhone searches conducted through its apps from 25% to the low 30s.

While this represents progress, it falls short of Google’s internal target of 50% by 2030.

The company has employed various marketing strategies, including campaigns showcasing features like Lens image search and improvements to the Discover feed.

Despite these efforts, Safari’s preinstalled status on iPhones remains an obstacle.

Financial Stakes & Market Dynamics

The financial implications of this struggle are considerable for both Google and Apple.

In 2023, Google reportedly paid over $20 billion to Apple to maintain its status as the default search engine on Safari.

By shifting more users to its apps, Google aims to reduce these payments and gain leverage in future negotiations.

Antitrust Lawsuit & Potential Consequences

The ongoing antitrust lawsuit threatens Google’s business model.

If Google loses the case, it could potentially lose access to approximately 70% of searches conducted on iPhones, which account for about half of the smartphones in the U.S.

This outcome could impact Google’s mobile search advertising revenue, which exceeded $207 billion in 2023.

New Initiatives & Leadership

To address these challenges, Google has brought in new talent, including former Instagram and Yahoo product executive Robby Stein.

Stein is now tasked with leading efforts to shift iPhone users to Google’s mobile apps, exploring ways to make the apps more compelling, including the potential use of generative AI.

Looking Ahead

With the antitrust ruling on the horizon, Google’s ability to attract users to its apps will determine whether it maintains its search market share.

We’ll be watching closely to see how Google navigates these challenges and if it can reduce its reliance on Safari.


Featured Image: photosince/shutterstock