Harvey Finkelstein, the president of Shopify, was recently interviewed about their open source Universal Commerce Protocol (UCP), which enables agentic AI shopping. Co-developed with Google, he explains how UCP enables brands to be discovered by customers based on personalized recommendations, as opposed to advertising and classic search paradigms that are less personalized.
Finkelstein said that the Universal Commerce Protocol (UCP) is designed to enable AI agents to surface products in a manner that merchants can control, show consumers personalized recommendations based on users’ preferences, and deliver a shopping experience that’s as good as any ecommerce store platform.
Shopify is also opening agentic commerce access to brands that are not Shopify customers through their Agentic plan, which he briefly mentions. This plan is designed for enterprise brands and merchants who do not use Shopify to upload their product data to Shopify’s infrastructure so it can be discovered and purchased directly by AI agents.
This positions Shopify as infrastructure for agentic commerce, not just a hosted commerce platform. This makes it easier for brands to gain immediate access to agentic shopping channels without having to migrate platforms.
Finkelstein also points out that agentic commerce only works if consumers can access all brands, not just those on Shopify.
Shopify’s Finkelstein said that UCP will enable merchants to more effectively control how their products are shown. He also discussed their strategy of bringing agentic shopping to all brands, regardless of whether they are on Shopify or not.
He explained:
“We created this protocol called Universal Commerce Protocol which effectively is this universal language is open sourced so that all merchants can speak directly to every single one of the agents.
And the best way to explain it is up until now, it was really just about like a single transaction.
So I can buy something on ChatGPT or Gemini or Microsoft. there’s no concept of loyalty or subscription or bundling or, you know, if it’s furniture, for example, please don’t ship it to me on Thursday. I’m not home Thursday. Send it Friday.
So this idea of creating this universal protocol that we co-developed with Google means that now merchants can actually tell these agents exactly how to show their products on these agentic tools. And it should be as good as it is on the online store. So that was a really, really big one.
The second thing we announced also with Google is that now we’re actually expanding. You can sell everywhere commerce is happening from an agentic perspective.
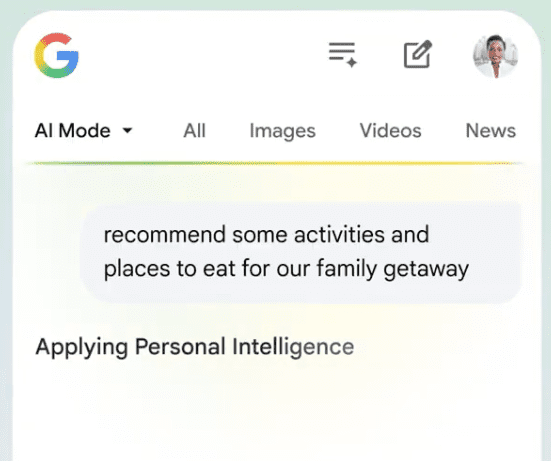
So we’re going beyond the agentic storefronts of just ChatGPT, which is what we said, you know, in Q3. Now it’s also, we’re going to be working with Gemini, with AI mode in Google Search, and also with copilot.
And maybe the last one is that we’re actually bringing agentic commerce to every brand, whether or not they’re on Shopify.
So if you’re not on Shopify, but you want to have your product syndicated and indexed, you can do so with our agentic plan.”
Access To Many Brands Is Key
Finkelstein stressed that the key to the success of agentic AI is to be able to show the widest possible selection of brands. He said it’s a big opportunity.
He explained:
“I think if Agentic is going to do what a lot of us think it’s going to do from a commerce perspective, you have to give consumers all the brands.
We obviously want them all on Shopify, but there’s some brands that want to participate now, but it may take some time for them to migrate over.
So this idea of opening up to anyone, we think is a big opportunity.”
Who Will Be The Early Adopters?
Finkelstein was asked about who the early adopters will be. His answer was cautious, seemingly acknowledging that it’s likely not going to immediately be a big crush of people turning to AI to buy things.
He answered:
“I think it’ll likely be something that like most people use some of the time and some people use most of the time. I don’t think it’s going to cross the threshold of most most, the way e-commerce does now. It’s just going to take time. It’s going to take some time.”
AI Chat Reduces Friction
Finkelstein said that Universal Commerce Protocol (UCP) enables better shopping experiences, reducing the “friction” that AI shopping may have produced. He believes that once people start having good experiences shopping with an agent, they will start to get into the habit of using it for other kinds of shopping and begin relying on it.
Finkelstein explained:
“Once you have a good experience, I think the actual friction reduces. You’ll keep having it over and over again.
But the thing that we felt was missing, and this is the reason why I think this UCP protocol is so important, is it was very difficult to do merchandising inside of these applications.
And this protocol allows you to do a lot more… Well, up until UCP happened, you couldn’t actually do subscriptions. Now you can.
Or this idea of bundling, you know, for Gymshark, it’s a huge part of their business is if you buy these, you’ll also buy these as well. You can do that as well.
So I think all of these things are sort of in line with creating a much more delightful experience in the chat.”
Merit Based Shopping Versus SEO?
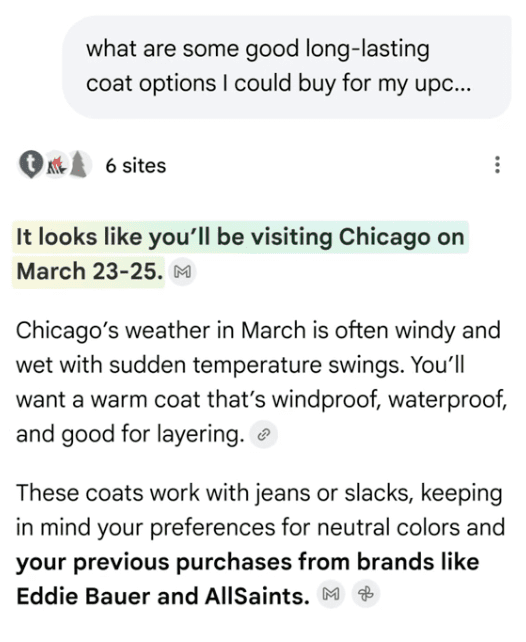
Finkelstein brought up the topic of merit-based shopping where products are recommended to a user because it is what they are looking for. He used the phrase “merit-based shopping” as a contrast to today’s online advertising ecosystems that prioritize products that pay to be shown as a recommendation. The main point is that shopping recommendations are made based on personalization.
Finkelstein explained:
“And I think ultimately what it leads to is like, this will be merit-based shopping, which will be different than I think some of the traditional retailers who were kind of leaning on their balance sheets to spend money on ads. You can’t really game the system in that that way.
You actually have to be, from a context perspective, the right product for the right consumer.”
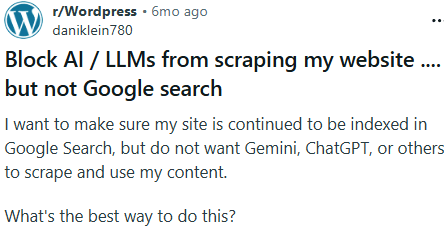
What Happens To Creative Assets And SEO
One of the podcast hosts asked about what happens to creative assets like photos, saying that he noticed that shopping AI uses images. He asked how that was going to evolve. Finkelstein’s answer touched on SEO in the context of how agentic AI shopping is about showing products based on user preferences, a tighter form of relevance than in the advertising and classic search ecosystems.
Finkelstein explained:
“I think …the idea of SEO won’t exist in Agentic because again, it’s merit-based and it’s mostly based on the context history you’ve had.
But I do think though, you’re going to have… these brands are going to have people at their companies who are thinking a lot about like consistent updates to UCP, consistent updates to the catalog.
So they may pull something off the catalog and say, we don’t want to sell it anymore this way. So I think there’s going to be, I don’t know if they’re going to be actual jobs, but there’s going to be people inside of the company, potentially in the merchandising department, who say, actually, the way that we want to sell all this, the way we want to describe this to these agents is a particular way.
And then because of UCP and because of Shopify catalog, it gets easily disseminated across every single one of these agentic applications. So the experience just gets better and better.
I think you have to be a little bit of a techno optimist… as I am, to believe that even if the experience is not incredible right now, it’s likely just going to get better at this ridiculous pace.”
Cutting Out Incentivized Recommendations
When asked what’s the most exciting thing about Agentic AI, he returned to the concept of merit-based shopping, where LLMs have the ability to personalize responses by learning user preferences and therefore recommend a product that fits within that person’s requirements. He contrasted that with what happens in the real world, where a salesperson’s recommendations are influenced by commissions.
So what he is excited about is the idea of the playing field being leveled. He mentioned the possibility of lesser-known brands, like True Classic Tees, being surfaced in AI shopping because that kind of brand is a match for a specific consumer.
He responded:
“Most of the excitement is actually around this idea of like, is there a potential for this to level the playing field? Meaning, you know, if I’ve done a bunch of research historically on an agentic application …about the stuff that I love, the brands that I love. …It probably should not show me a generic pair of boots.
So the excitement actually is around like, is this going to introduce more brands that otherwise are unknown to more people or, you know, True Classic Tee, for example, which, you know, if you’re looking for a black t-shirt, I suspect on a search engine, you’re not going to see True Classic Tee come up that much, but it’s an incredible product and ultimately it can be found on these agentic tools in a way that it probably couldn’t historically.”
Agentic AI Will Accelerate Online Shopping
The other thing that Finkelstein is excited about is that he believes Agentic AI shopping will accelerate the amount of shopping that is done online. He compared using Agentic AI to the COVID moment, where people changed their work and shopping behavior in a major way that became permanent.
He then circled back to the idea that Agentic AI is less biased:
“I think it’s actually a better version of that because it’s an unbiased discussion, an unbiased conversation.”
Watch the video podcast interview at a few minutes after the 3 hour mark:
Featured Image by Shutterstock/Julien Tromeur