In a move to increase user privacy, Google Maps launched updates to give users more control over location data storage and recent activity.
With these updates, users will be able to manage their Location History with greater precision. The changes could, however, affect analytics data marketers utilize for location targeting.
Timeline Storage On Local Device
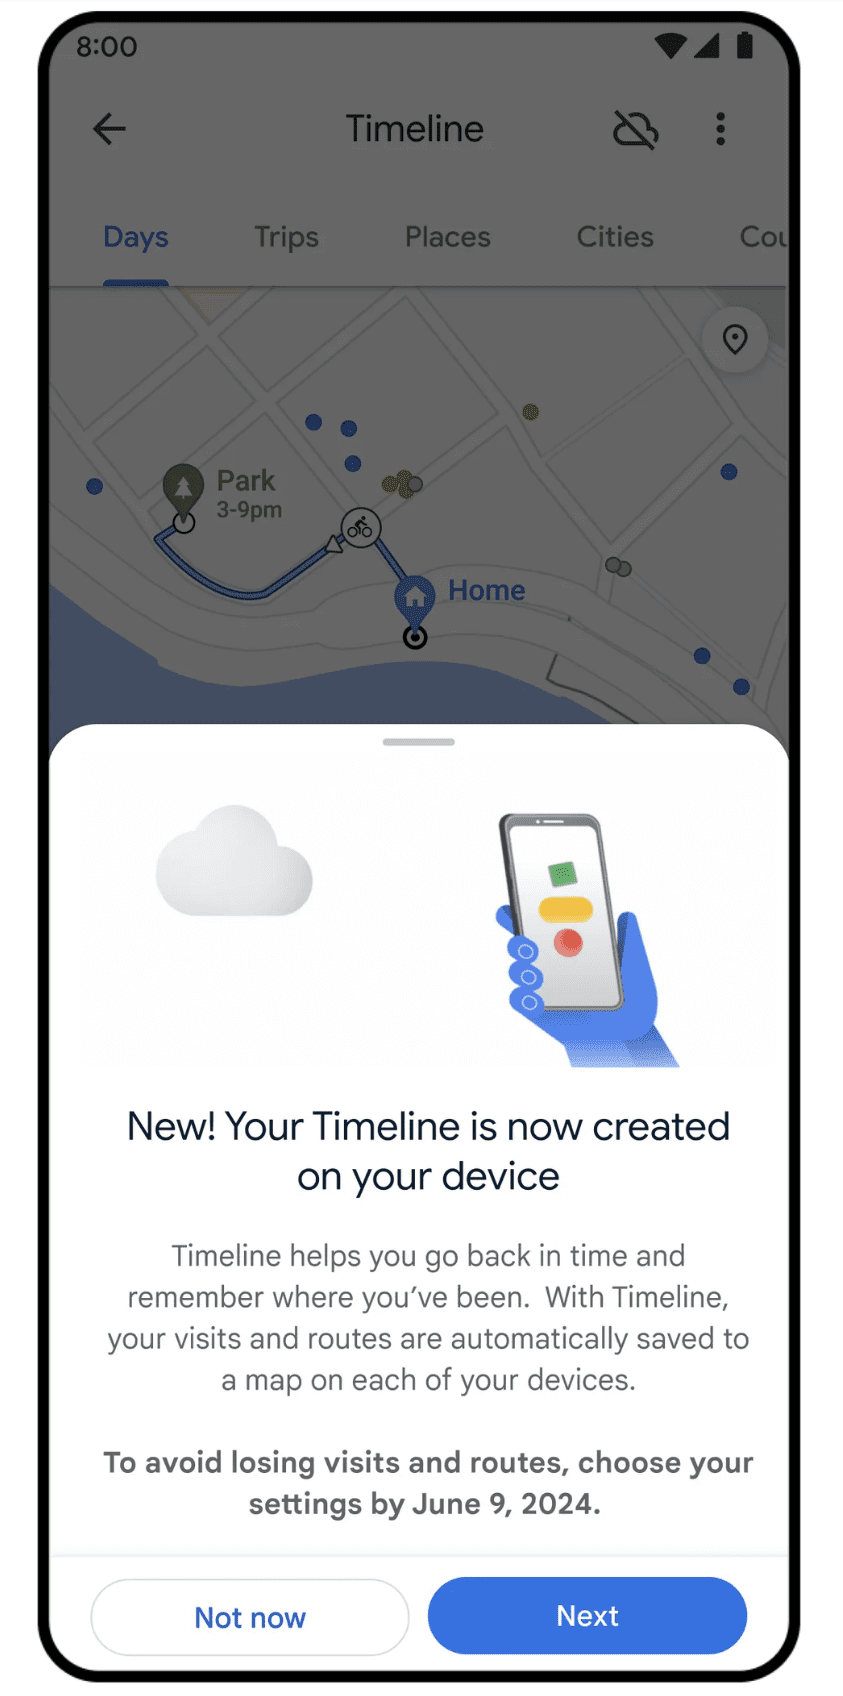
First, the Timeline feature in Google Maps, a tool that assists users in recalling places they have been, is receiving a significant privacy-oriented update.
Screenshot from Google, December 2023
Users with Location History turned on will soon find that their Timeline will be stored directly on their devices rather than on cloud servers.
This storage decision gives users extra autonomy over their location data and the assurance that it remains private.
For those switching phones or worried about device loss, there is the option to back up their Timeline to the cloud.
Impact On Marketers
On-device storage and deletion tools could limit the amount of user location data available for ad targeting, potentially impacting campaigns that rely heavily on location-based targeting.
Updated Location History Controls
When Google Maps users activate the auto-delete function for Location History, it will have a default three-month lifecycle. Previously, this default setting was set to 18 months.
Screenshot from Google, December 2023
Users can customize this option to keep location data longer or turn off location tracking.
Impact On Marketers
Users may be more cautious about sharing location data, leading to changes in search behavior and potentially impacting the effectiveness of location-based keywords and ad copy.
Ads emphasizing user privacy and control might resonate better with users, like highlighting opt-in features for location sharing or transparent data usage policies.
Delete Recent Activity In Location History
In the upcoming weeks, support for managing location information related to specific places directly in the Maps app will be introduced.
Screenshot from Google, December 2023
Adding to the convenience, the blue dot in Google Maps, which symbolizes the user’s current location, will now act as a quick access point to location settings.
A simple tap will display whether Location History or Timeline is engaged and if Maps can access device location data.
This feature could be valuable for shopping for the holidays or planning a surprise by allowing users to cover their digital tracks.
Impact On Marketers
If the changes to Google Maps result in less location data, contextual targeting based on user interests and online behavior might become more important.
Conclusion
These updates, which will gradually roll out over the next year on Android and iOS, demonstrate Google’s commitment to user privacy.
Google will roll out new features and integrations for Google Analytics 4 (GA4) for first-party data, enhanced conversions, and durable ad performance metrics.
Beginning in Q1 2024, Chrome will gradually phase out third-party cookies for a percentage of users, allowing for testing and transition.
Third-party cookies, which have been central to cross-site tracking, are being restricted or phased out by major browsers, including Chrome, as part of its Privacy Sandbox project.
The following features should help advertisers “unlock durable performance” while preserving user privacy.
Support For Protected Audience API In GA4
A key feature of recent updates to Google Analytics 4 is the integration of Protected Audience API, a Privacy Sandbox technology that is set to become widely available in early 2024.
This API allows advertisers to continue reaching their audiences after the third-party cookie phase-out.
What Is The Protected Audience API?
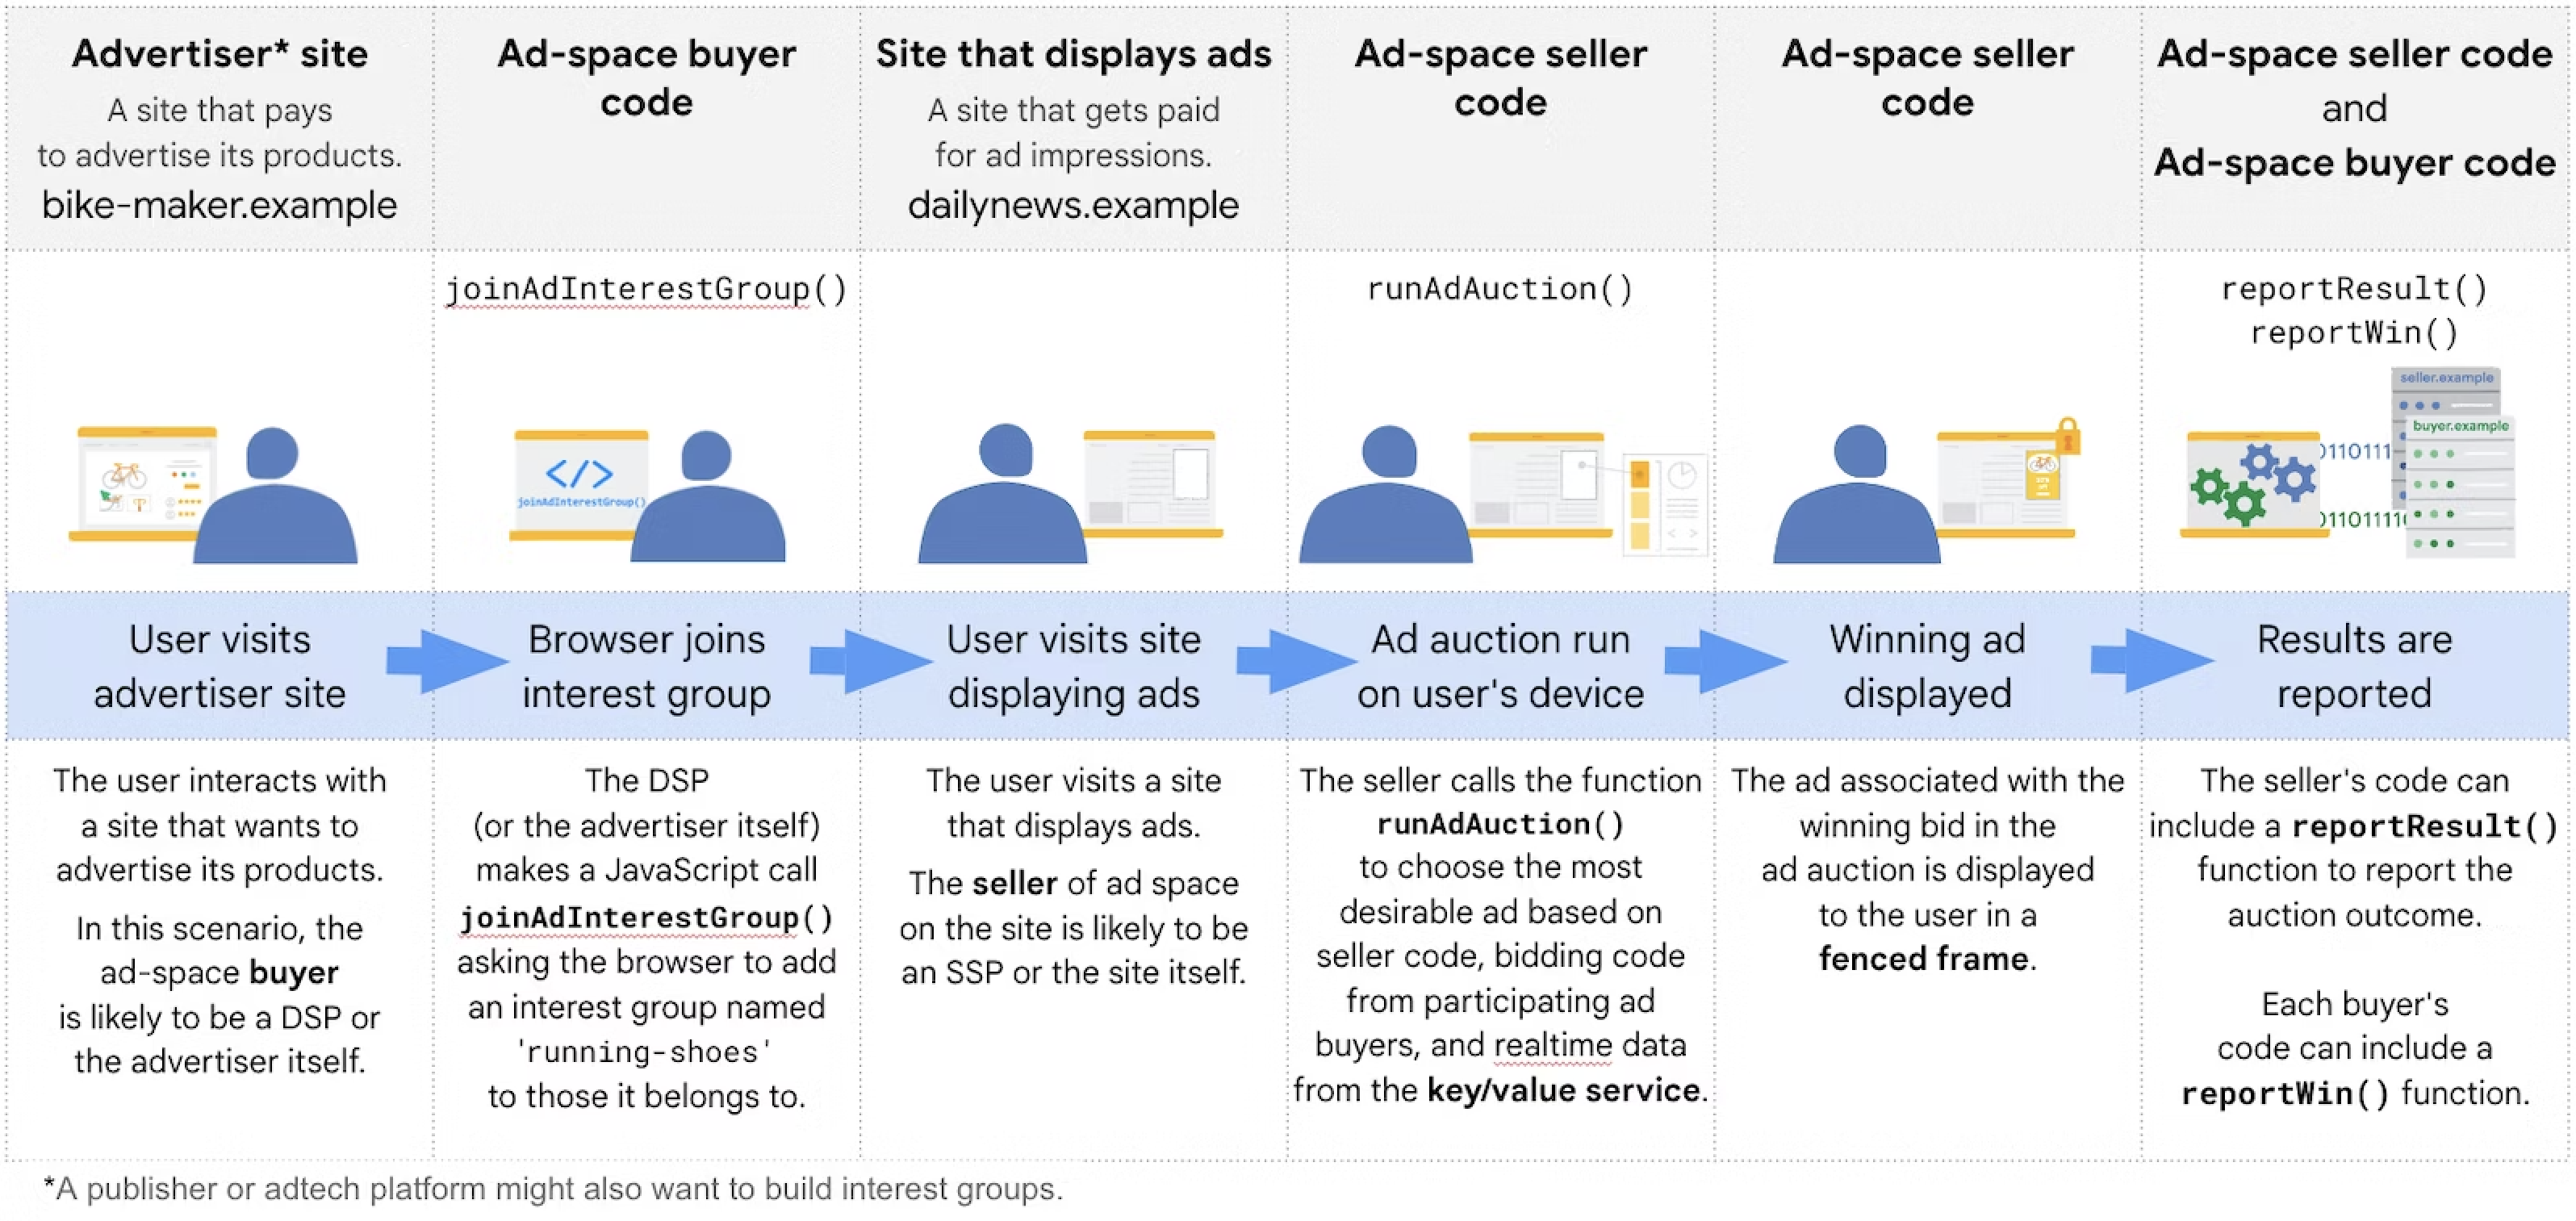
The Protected Audience API offers a novel approach to remarketing, which involves reminding users about sites and products they have shown interest in without relying on third-party cookies.
Screenshot from Google, December 2023
This method involves advertisers informing the browser directly about their interest in showing ads to users in the future.
The browser then uses an algorithm to determine which ads to display based on the user’s web activity and advertiser inputs.
It enables on-device auctions by the browser, allowing it to choose relevant ads from sites previously visited by the user without tracking their browsing behavior across different sites.
Key Features And Development
Key features of the Protected Audience API include interest groups stored by the browser, on-device bidding and ad selection, and ad rendering in a temporarily relaxed version of Fenced Frames.
The API also supports a key/value service for real-time information retrieval, which can be used by both buyers and sellers for various purposes, such as budget calculation or policy compliance.
The Protected Audience API, initially known as the FLEDGE API, has evolved from an experimental stage to a more mature phase, reflecting its readiness for wider implementation.
This transition is part of Google’s broader efforts to develop privacy-preserving APIs and technologies in collaboration with industry stakeholders and regulatory bodies like the UK’s Competition and Markets Authority.
The Protected Audience API offers a new way to connect with users while respecting their privacy, necessitating a reevaluation of current advertising strategies and a focus on adapting to these emerging technologies.
Support For Enhanced Conversions
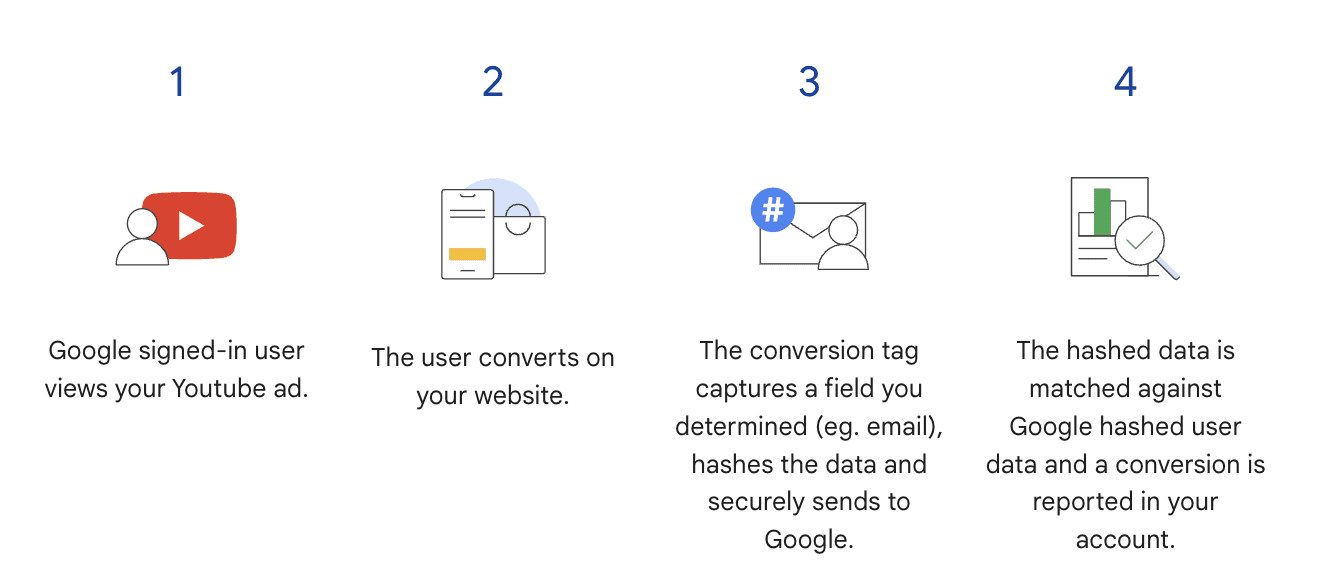
Rolling out in the next few weeks, enhanced conversions is a feature enhancing conversion measurement accuracy.
Screenshot from Google, December 2023
Enhanced conversions for the web cater to advertisers tracking online sales and events. It captures and hashes customer data like email addresses during a conversion on the web, then matches this with Google accounts linked to ad interactions.
This method recovers unmeasured conversions, optimizes bidding, and maintains data privacy.
For leads, enhanced conversions track sales from website leads occurring offline. It uses hashed data from website forms, like email addresses, to measure offline conversions.
Advertisers can import offline conversion data for Google Ads from Salesforce, Zapier, and HubSpot with Google Click Identifier (GCLID).
Proper Consent Setup
To effectively use Google’s enhanced privacy features, it’s essential to have proper user consent mechanisms in place, particularly for traffic from the European Economic Area (EEA).
Google’s EU user consent policy mandates consent collection for personal data usage in measurement, ad personalization, and remarketing features. This policy extends to website tags, app SDKs, and data uploads like offline conversion imports.
Google has updated the consent mode API to include parameters for user data consent and personalized advertising.
Advertisers using Google-certified consent management platforms (CMPs) will see automatic updates to the latest consent mode, while those with self-managed banners should upgrade to consent mode v2.
Implementing consent mode allows you to adjust Google tag behavior based on user consent, ensuring compliance and enabling conversion modeling for comprehensive reporting and optimization.
Consent Mode integration with CMPs simplifies managing consent banners and the consent management process, adjusting data collection based on user choices and supporting behavioral modeling for a complete view of consumer performance.
Durable Ad Performance With AI Essentials
To effectively utilize AI, marketers need robust measurement and audience tools for confident decision-making.
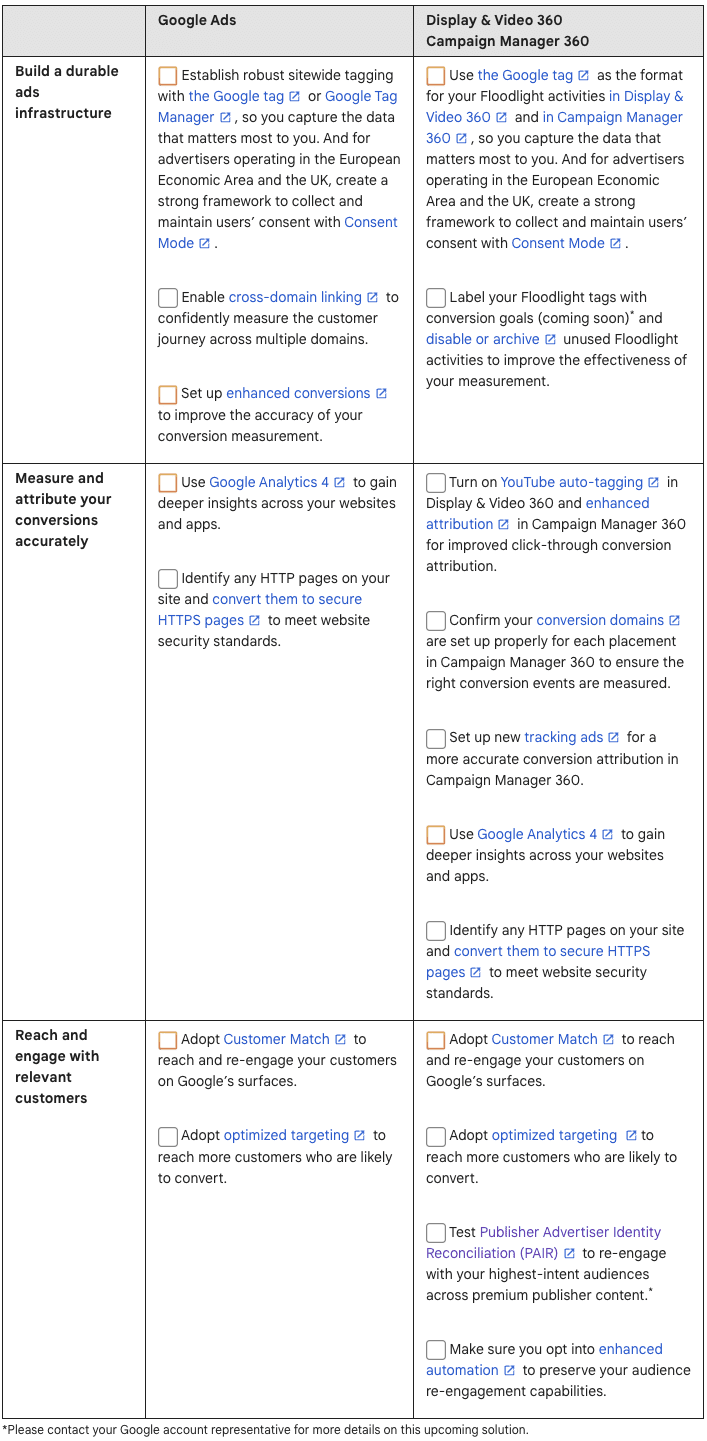
Google provided a general checklist of AI essentials for Google advertisers. In it, advertisers are encouraged to adopt AI-poweredsearch and Performance Max campaigns, engage in Smart Bidding, and explore video campaigns on platforms like YouTube.
Google also offers a more in-depth checklist for Google Ads, Display & Video 360, and Campaign Manager 360.
Screenshot from Google, December 2023
More Ways To Prepare For The Third-Party Cookie Phase Out
As third-party cookies are phased out, it’s essential to audit and modify web code, especially focusing on instances of SameSite=None using tools like Chrome DevTools.
Adapting to this change involves understanding and managing both third-party and first-party cookies, ensuring they are set correctly for cross-site contexts and compliance.
Chrome provides solutions like Partitioned cookies with CHIPS and Related Website Sets.
At the same time, the Privacy Sandbox introduces APIs for privacy-centric alternatives, with additional support for enterprise-managed Chrome and ongoing development of tools and trials to assist in the transition.
As Google continues to update resources and documentation to reflect these changes, stakeholders are encouraged to engage and provide feedback, ensuring that the evolution of these technologies aligns with industry needs and user privacy standards.
Claravine and Advertiser Perceptions surveyed 140 marketers and agencies to better understand the impact of data standards on marketing data, and they’re ready to present their findings. Want to learn how you can mitigate privacy risks and boost ROI through data standards?
Watch this on-demand webinar and learn how companies are addressing new privacy laws, taking advantage of AI, and organizing their data to better capture the campaign data they need, as well as how you can implement these findings in your campaigns. In this webinar, you will:
Gain a better understanding of how your marketing data management compares to enterprise advertisers.
Get an overview of the current state of data standards and analytics, and how marketers are managing risk while improving the ROI of their programs.
Walk away with tactics and best practices that you can use to improve your marketing data now.
Chris Comstock, Chief Growth Officer at Claravine, will show you the marketing data trends of top advertisers and the potential pitfalls that come with poor data standards.
Learn the key ways to level up your data strategy to pinpoint campaign success.
SaaS Marketing: Expert Paid Media Tips Backed By $150M In Ad Spend
Join us and learn a unique methodology for growth that has driven massive revenue at a lower cost for hundreds of SaaS brands. We’ll dive into case studies backed by real data from over $150 million in SaaS ad spend per year.
The Census Bureau of the U.S. Department of Commerce reports quarterly domestic retail ecommerce sales. Newly released figures (PDF) for Q3 2023 show sales of $281.1 billion, a growth of 2.3% over the prior quarter.
Per the DoC, ecommerce sales are for “goods and services where the buyer places an order (or the price and terms of the sale are negotiated) over an Internet, mobile device, extranet, electronic data interchange network, electronic mail, or other comparable online system. Payment may or may not be made online.”
The DoC’s estimated total retail sales (online and in-store) for Q3 2023 stood at $1,825.3 billion, an increase of 1.5% from Q2 2023.
–
Ecommerce accounted for 15.6% of total U.S. retail sales in Q3 2023, up slightly from 15.5% in the prior quarter.
–
The DoC estimates U.S. ecommerce retail sales in Q3 2023 grew by 7.6% compared to Q3 2022, while total quarterly retail sales experienced a 2.3% annual rise in the same period.
The reports in Google Analytics 4 can be confusing. Take, for example, acquisition reports — the channels sending traffic to your site — at Reports > Acquisition. The section lists two types of acquisition: user and traffic (i.e., sessions).
I’ll address those reports in this post.
Traffic Sources in GA4
“User acquisition” vs. “Traffic acquisition”
These two reports in the Acquisition section disclose where each visitor came from. User acquisition represents the initial source that brought the person to your site. Traffic acquisition is the most recent.
Say a first-time visitor came to your site from clicking an organic search listing. GA4 will group that initial visit in the “Organic search” channel for both reports. But if she leaves and returns a few days later from a Facebook ad, GA4 will list the second visit in the “Paid social” channel in the “Traffic acquisition” report and “Organic search” in “User acquisition.”
In other words, the “Traffic acquisition” report doesn’t differentiate between new and returning users. It shows the total sessions and where each originated. The “User acquisition” report shows the total users and their initial (first-time) source.
Channels
Both reports show “default channel groups” — traffic-source categories — including:
“Direct.” Visitors who typed your URL in their browser’s search bar.
“Organic Search.” Visitors who clicked an organic listing on Google, Bing. or another search engine.
“Organic Social.” Visitors who clicked an organic post on a social media site.
“Email.”
“Paid Search.”
“Paid Social.”
“Referral.” Visitors who clicked non-ad links on third-party sites.
“Organic Video.” Visitors who clicked non-ad links on sites such as YouTube, TikTok, and Vimeo.
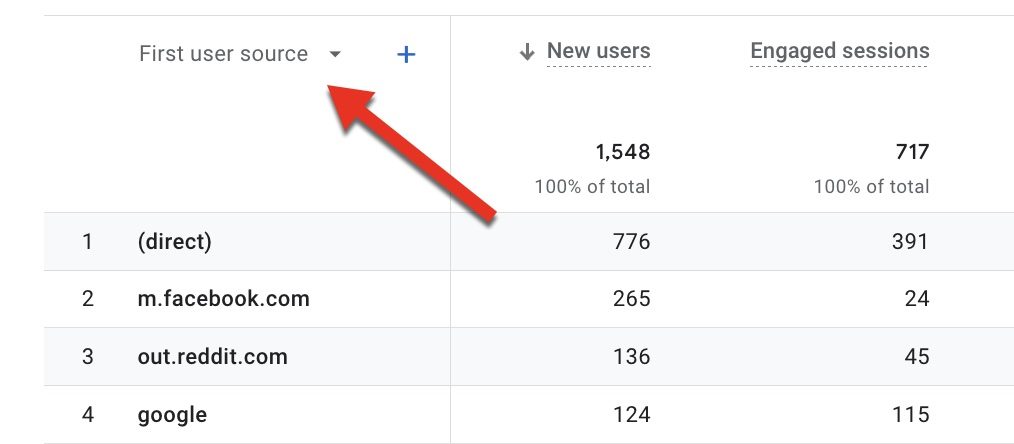
For details on each channel, click the drop-down menus on each report. In “User Acquisition,” click the “First user default channel group” menu and select “First user source” for the list of originating domains.
For detailed sources of users, click the “First user default channel group” menu and select “First user source.” Click image to enlarge.
In the “Traffic Acquisition” report, click “Session default channel group” and select “Session source.”
For detailed sources of sessions, click the “Session default channel group” menu and select “Session source.” Click image to enlarge.
The numbers may be different owing to new versus returning visits.
You can limit both reports to a single page via the “Add filter” option at the top.
Select “Add filter.”
Click “Select dimensions.”
Select “Landing page + query string”
Select “contains” below “Match type.”
Paste your page’s URL slug (the part after the “/”) or any word (such as “smaller”) from that URL.
The traffic and user acquisition reports will now show data for that URL.
Limit the acquisition reports to a single page, such as this example for a URL containing “smaller.” Click image to enlarge.
In many cases, the user and traffic acquisition reports are interchangeable. The differences, again, result from returning visitors. Regardless, the reports show the sources of traffic — channels that introduce your brand and drive return visits.
CallRail has analyzed more than 100 million phone calls and consumer communication trends, and they’re ready to share their findings with you.
On November 1, I moderated a webinar with Jason Tatum, CallRail’s VP of Product. Tatum covered the past and future state of phone calls and how you can use AI to gain valuable insights that will transform your business.
Here’s a summary of the webinar. To access the entire presentation, complete the form.
What We Uncovered
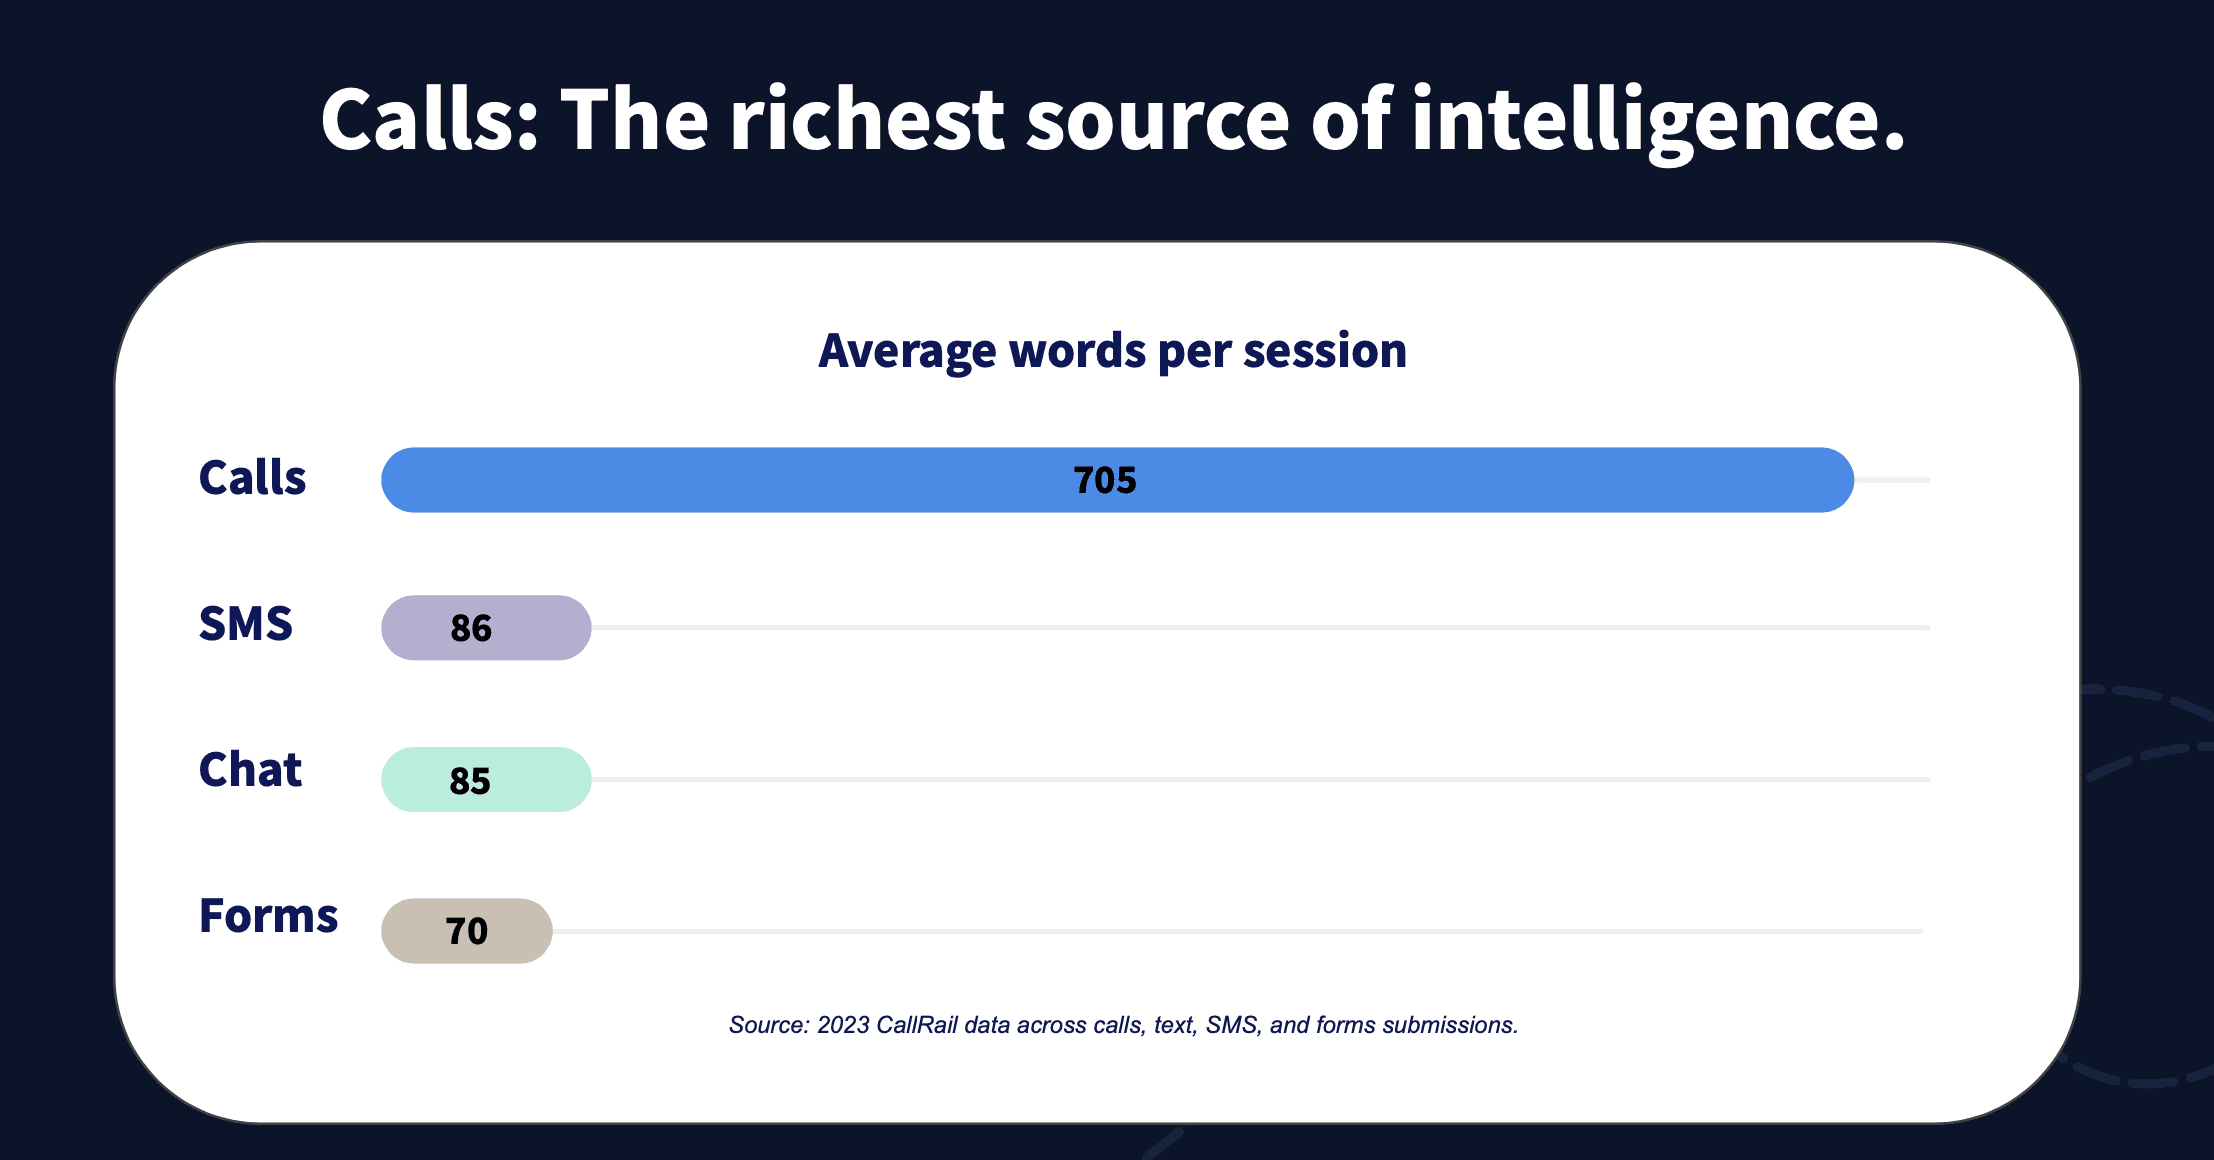
Consumers prefer to call businesses for many types of transactions — particularly high-stakes purchases such as in healthcare or insurance, where two-thirds of consumers prefer calling over any other type of contact.
100M Phone Call Insights: Your Key To Data-Driven Marketing Strategies [Slides]
Here’s the presentation:
Join Us For Our Next Webinar!
The Evolution Of Search & SERPs 2024
In this roundtable discussion with Shelley Walsh, Ben Steele, and Matt Southern, you’ll get expert insights into the evolution of search to give you a competitive advantage in 2024.
Insider Intelligence projects U.K. ecommerce retail sales to decrease in 2023 by 0.6%, leading to a reduced share of total retail sales at 32.0%. This is a decline from its peak of 37.6% in 2021.
–
Amazon.co.uk secured the top U.K. ecommerce position in 2022 with net sales of $15.36 billion, followed by Sainsburys.co.uk at $7.59 billion. Tesco.com claimed the third spot with net sales of $7.16 billion.
That’s according to Statista, which defines ecommerce as the sale of physical goods via a digital channel to a private end user.
–
Per Insider Intelligence (formerly eMarketer), China will remain the world’s largest ecommerce market in 2023, followed by the U.S. The U.K. will finish third with total annual ecommerce revenue in 2023 of $196 billion.
–
According to Semrush, in September 2023, Amazon.co.uk was the most trafficked retail site in the United Kingdom, with nearly 412.93 million monthly visits. Ebay.co.uk secured second with 176.08 million, while Argos.co.uk drew 43.45 million visits.

 Screenshot from Google, December 2023
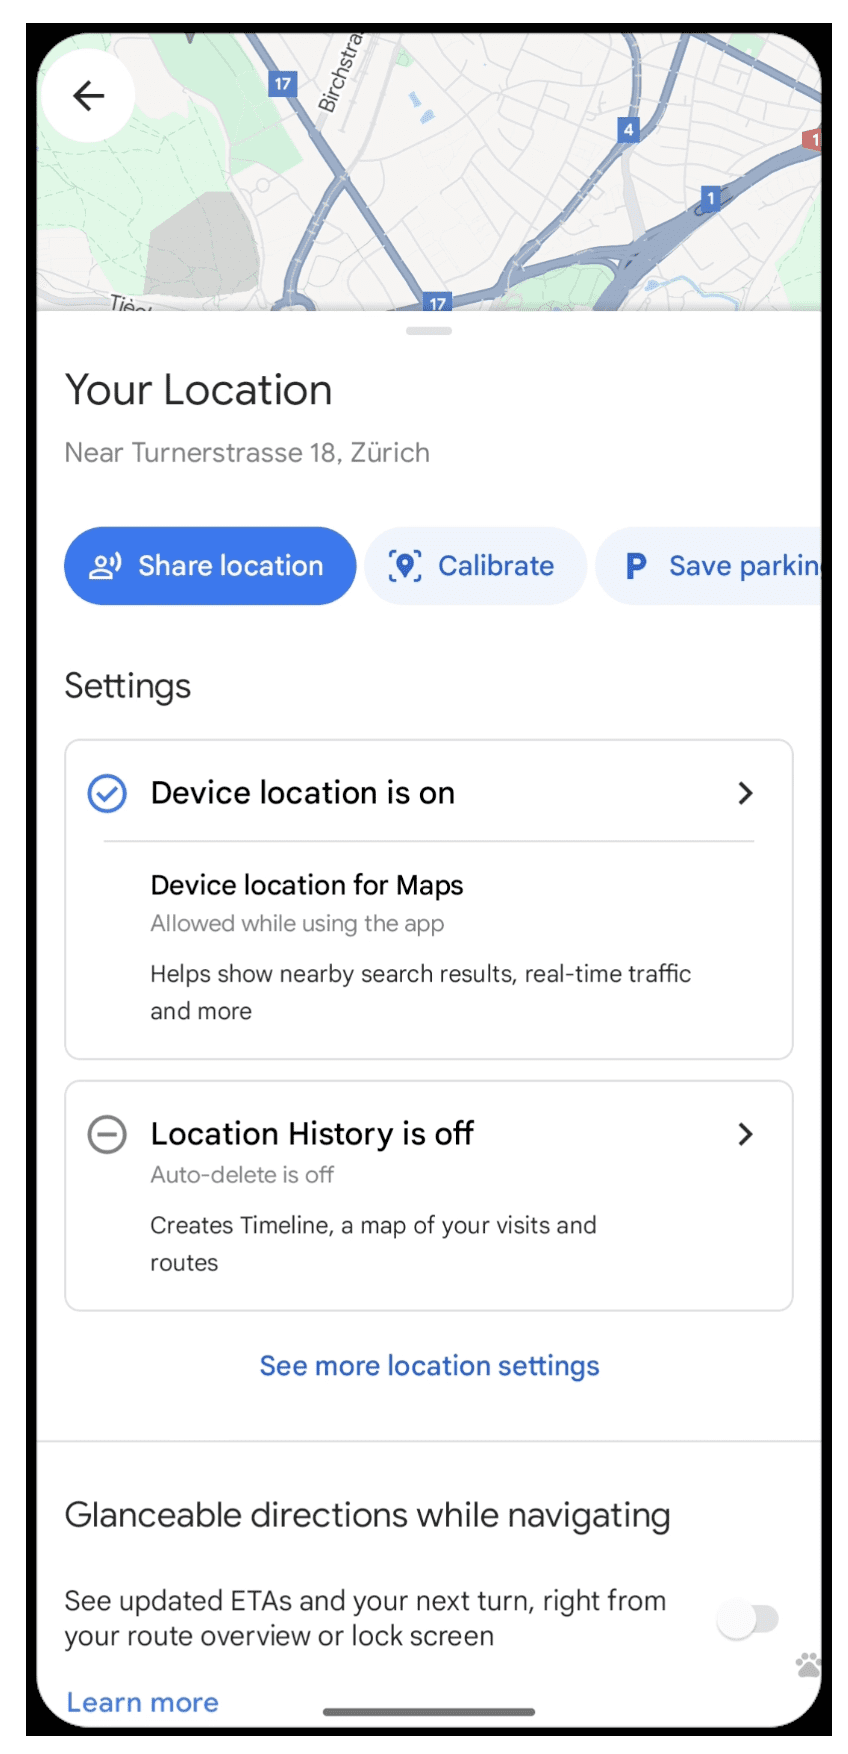 Screenshot from Google, December 2023
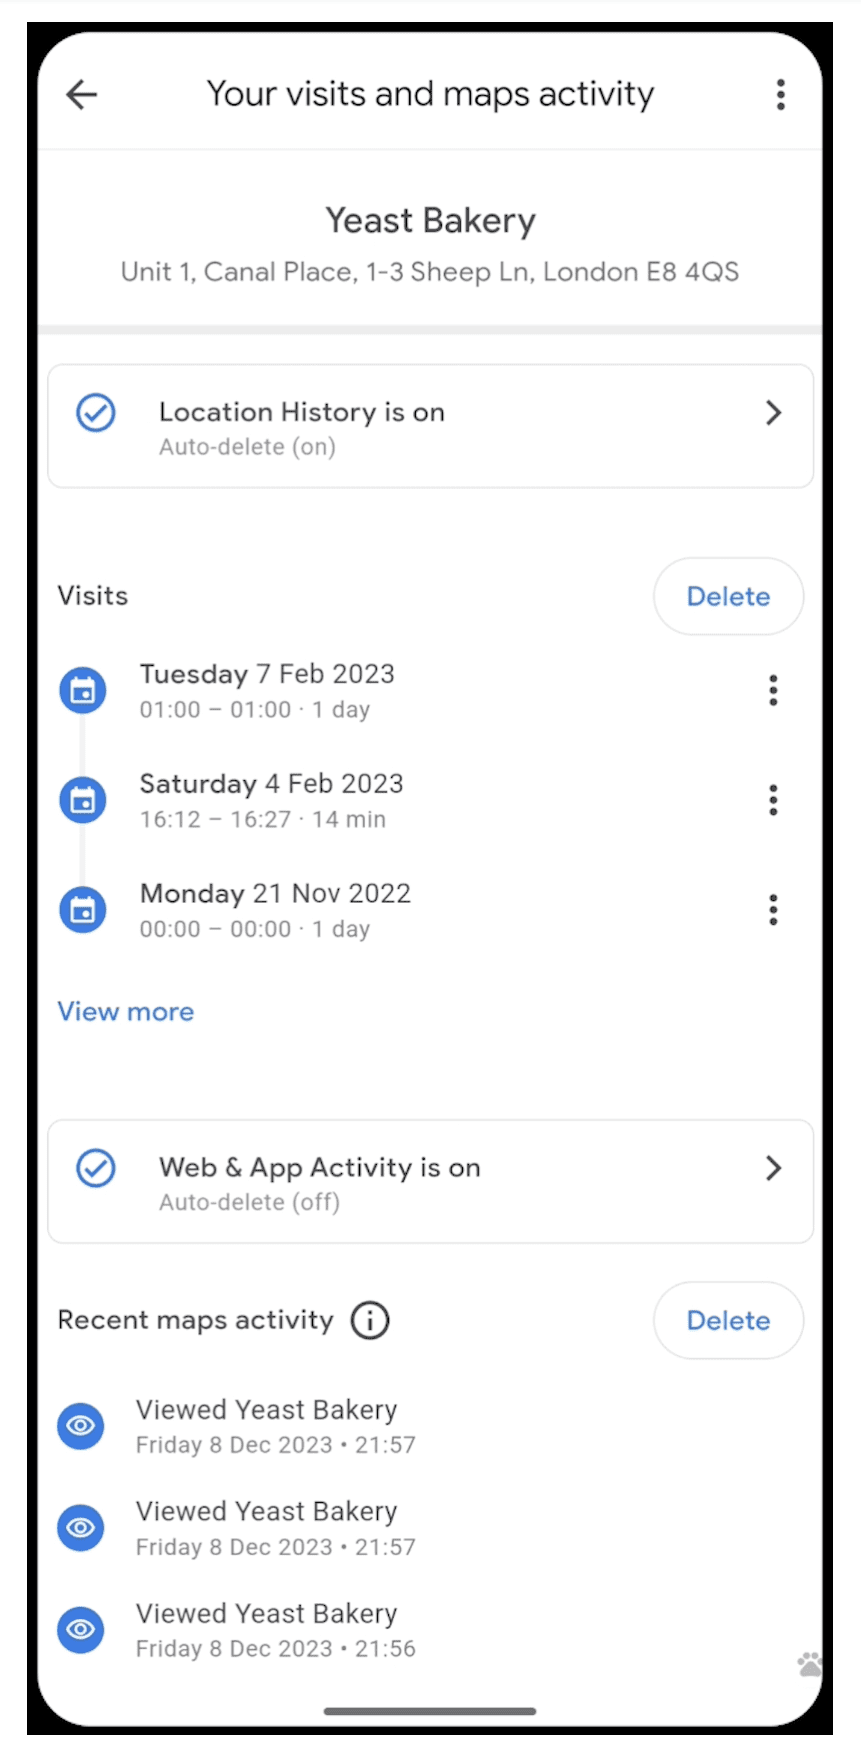 Screenshot from Google, December 2023