The Core Web Vitals Technology Report by the open source HTTPArchive community ranks content management systems by how well they perform on Google’s Core Web Vitals (CWV). The July update shows that every major platform has improved since June, but not all gains were equal. Joomla posted the largest month-over-month increase, while Duda ranked first in July with 84.96% of sites passing CWV.
Why Core Web Vitals Matter
Core Web Vitals (CWV) are metrics created by Google to measure how fast, stable, and responsive a website feels to users. Websites that load quickly and respond smoothly keep visitors engaged, while sites that fall short frustrate users and increase bounce rates. For businesses and publishers, CWV scores reflect the user experience and competitiveness online.
How the Data Is Collected
The CWV Technology Report combines two public datasets:
Chrome UX Report (CrUX): Data from Chrome users who opt in to share performance statistics as they browse. This reflects how real users experience websites.
HTTP Archive: Lab-based tests that analyze how sites are built and whether they follow performance best practices.
Together, these sources provide a consistent picture of how different website platforms perform on Core Web Vitals in the real world.
Percentage Change from June to July
#1 Joomla — largest gain (+3.23%).
#2 Wix — +2.61%.
#3 Drupal — +1.47%.
#4 Duda — +1.33%.
#5 Squarespace — +1.27%.
#6 WordPress — smallest gain (+0.90%).
This ranking shows which platforms advanced most in July. Joomla experienced the highest level of growth, while WordPress improved the least. Wix’s CWV month over month performance improvement was a notable 2.51%.
Ranking by July CWV Score
Duda once again is the Core Web Vitals champion, ranked by the percentage of websites that has a good CWV score.
#1 Duda — 84.96%
#2 Wix — 73.37%
#3 Squarespace — 68.93%
#4 Drupal — 60.54%
#5 Joomla — 54.78%
#6 WordPress — 44.34%
Joomla showed the fastest growth, but it still ranked fifth in July. Duda led with the highest overall performance.
Why the Numbers Matter
Core Web Vitals scores translate into real differences in how users experience websites. Platforms with higher CWV scores offer faster, smoother interactions, while those at the bottom frustrate users with slower performance. While all six platforms in the comparison are improving month to month, what matters most is the actual experience users get right now.
Duda is the Core Web Vitals champion in July with a score of 84.96% of websites built with the Duda platform having a good CWV score.
Joomla had the largest gain, but still ranked near the bottom with only 54.78% of sites showing a good CWV score.
Wix and Squarespace ranked in the second and third places, showing strong performance but both significantly behind Duda by over ten percentage points.
WordPress ranked last, both in July scores and in the month over month rate of improvement.
Do Content Management Systems Matter For Ranking?
I have seen discussions online about whether the choice of content management system has an impact on rankings. Some people assert that plugins make WordPress easier to rank in Google.
There is also a perception that WordPress is faster than Wix, Duda, and Squarespace. The facts, of course, show that the opposite is true. WordPress is the slowest of the content management systems in this comparison.
The percentage of sites built with Duda that had a good Core Web Vitals score is 84.96%. The percentage of WordPress sites with a good CWV score is 44.34%. That means Duda’s percentage of sites with good CWV scores is about 92% higher than those built with WordPress.
Another issue with WordPress is that it has a considerable amount of technical debt, something that private content management systems do not have to struggle with to the same degree. Technical debt refers to the accumulation of outdated code and design decisions that make it harder to maintain, update, or improve the platform over time. It is not unique to WordPress, but it is an issue because of how WordPress is built and how its ecosystem works.
Some reasons for WordPress’s technical debt:
WordPress was originally conceived as a blogging platform and has evolved into a full CMS, able to be extended as virtually any kind of website.
Adding new features on top of legacy code means workarounds must be made for backward compatibility, which creates complexity and slows down innovation.
High volunteer demands with insufficient systemic support.
Lack of equitable financial remuneration or stipends for ongoing work.
Pressure to maintain legacy systems and innovate new features leads to overwhelming workloads.
Consequences
Loss of institutional knowledge and experienced contributors.
Increasing technical debt and slowed innovation cycles.
Threat to WordPress’s long-term ecosystem health.”
WordPress has recently moved to a slower annual release cycle, and one of the benefits of that change (summarized by WordPress here) is that it gives the project time to address the issue of technical debt.
The point is that if the content management system did have an effect on the ability to rank, WordPress sites would probably struggle to rank because of the relatively poor performance scores and the slower pace of development when compared to private content management systems like Wix. But that’s not the case.
WordPress websites rank very well despite all the issues with the platform, including security. So it may be that the choice of CMS does not necessarily matter for SEO, especially since private solutions like Wix and Duda are purposely built with SEO in mind. Nevertheless, performance is important for things that matter, such as conversions and the user experience, and the fact is that the HTTPArchive Technology Comparison Report ranks WordPress last for Core Web Vitals performance in July.
Bias in search isn’t always negative. It’s easy to frame it as something sinister, but bias shows up for structural reasons, behavioral reasons, and sometimes as a deliberate choice. The real task for marketers and communicators is recognizing when it’s happening, and what that means for visibility, perception, and control.
Two recent pieces got me thinking more deeply about this. The first is Dejan’s exploration of Selection Rate (SR), which highlights how AI systems favor certain sources over others. The second is Bill Hartzer’s upcoming book “Brands on the Ballot,” which introduces the concept of non-neutral branding in today’s polarized market. Put together, these show how bias isn’t just baked into algorithms; it’s also unavoidable in how brands are interpreted by audiences.
Image Credit: Duane Forrester
Selection Rate And Primary Bias
Selection Rate can be thought of as the percentage of times a source is chosen out of the available options (selections ÷ options × 100). It’s not a formal standard, but a useful way to illustrate primary bias in AI retrieval. Dejan points out that when an AI system is asked a question, it often pulls from multiple grounding sources. But not all sources are selected equally. Over time, some get picked again and again, while others barely show up.
That’s primary bias at work.
For marketers, the implication is clear: If your content is rarely chosen as a grounding source, you’re effectively invisible inside that AI’s output ecosystem. If it’s selected frequently, you gain authority and visibility. High SR becomes a self-reinforcing signal.
This isn’t just theoretical. Tools like Perplexity, Bing Copilot, and Gemini surface both answers and their sources. Frequent citation enhances your brand’s visibility and perceived authority. Researchers even coined a term for how this feedback loop can lock in dominance: neural howlround. In an LLM, certain highly weighted inputs can become entrenched, creating response patterns that are resistant to correction, even when new training data or live prompts are introduced.
This concept isn’t new. In traditional search, higher-ranked pages earn more clicks. Those clicks send engagement signals back into the system, which can help sustain ranking position. It’s the same feedback loop, just through a different lens. SR doesn’t create bias; it reveals it, and whether you benefit depends on how well you’ve structured your presence to be retrieved in the first place.
Branding And The Reality Of Interpretation
Brands on the Ballot frames this as non-neutral branding: Companies can’t avoid being interpreted. Every decision, big or small, is read as a signal. That’s bias at the level of perception.
We see this constantly. When Nike featured Colin Kaepernick, some people doubled down on loyalty while others publicly cut ties. When Bud Light partnered with a trans influencer, backlash dominated national news. Disney’s disputes with Florida politicians over cultural policy became a corporate identity story overnight.
None of these were just “marketing campaigns.” Each was read as a cultural stance. Even decisions that seem operational (which platforms you advertise on, which sponsorships you accept, which suppliers you choose) are interpreted as signals of alignment.
Neutrality doesn’t land as neutral anymore, which means PR and marketing teams alike need to plan for interpretation as part of their day-to-day reality.
Directed Bias As A Useful Lens
Marketers already practice deliberate exclusion through ICP targeting and positioning. You decide who you want to reach and, by extension, who you don’t. That’s not new.
But when you view those choices through the lens of bias, it sharpens the point: Positioning is bias with intent. It’s not hidden. It’s not accidental. It’s a deliberate narrowing of focus.
That’s where the idea of directed bias comes in. You can think of it as another way to describe ICP targeting or market positioning. It’s not a doctrine, just a lens. The value in naming it this way is that it connects what marketers already do to the broader conversation about how search and AI systems encode bias.
Bias isn’t confined to branding or AI. We’ve known for years that search rankings can shape behavior.
A 2024 PLOS study showed that simply altering the order of results can shift opinions by as much as 30%. People trust higher-ranked results more, even when the underlying information is the same.
Filter bubbles amplify this effect. By tailoring results based on history, search engines reinforce existing views and limit exposure to alternatives.
Beyond those behavioral biases lie structural ones. Search engines reward freshness, meaning sites crawled and updated more frequently often gain an edge in visibility, especially for time-sensitive queries. Country-code top-level domains (ccTLDs) like .fr or .jp can signal regional relevance, giving them preference in localized searches. And then there’s popularity and brand bias: Established or trusted brands are often favored in rankings, even when their content isn’t necessarily stronger, which makes it harder for smaller or newer competitors to break through.
For marketing and PR professionals, the lesson is the same: Input bias (what data is available about you) and process bias (how systems rank and present it) directly shape what audiences believe to be true.
Bias In LLM Outputs
Large language models introduce new layers of bias.
Training data is rarely balanced. Some groups, voices, or perspectives can be over-represented while others are missing. That shapes the answers these systems give. Prompt design adds another layer: Confirmation bias and availability bias can creep in depending on how the question is asked.
Recent research shows just how messy this can get.
MIT researchers found that even the order of documents fed into an LLM can change the outcome.
A 2024 Nature paper catalogued the different types of bias showing up in LLMs, from representation gaps to cultural framing.
A PNAS study confirmed that even after fairness tuning, implicit biases still persist.
LiveScience reported that newer chatbots tend to oversimplify scientific studies, glossing over critical details.
These aren’t fringe findings. They show that bias in AI isn’t an edge case; it’s the default. For marketers and communicators, the point isn’t to master the science; it’s to understand that outputs can misrepresent you if you’re not shaping what gets pulled in the first place.
Pulling The Threads Together
Selection Rate shows us bias at work inside AI retrieval systems. Branding shows us how bias works in the marketplace of perception. Directed bias is a way to connect those realities, reminding us that not all bias is accidental. Sometimes it’s chosen.
The key isn’t to pretend bias doesn’t exist; of course, it does. It’s to recognize whether it’s happening to you passively, or whether you’re applying it actively and strategically. Both marketers and PR specialists have a role here: one in building retrievable assets, the other in shaping narrative resilience. (PS: An AI cannot really replace a human for this work.)
So what should you do with this?
Understand Where Bias Is Exposed
In search, bias is revealed through studies, audits, and SEO testing. In AI, it’s uncovered by researchers probing outputs with structured prompts. In branding, it’s revealed in customer reaction. The key is knowing that bias always shows itself somewhere, and if you’re not looking for it, you’re missing critical signals about how you’re being perceived or retrieved.
Recognize Who Hides Bias
Search engines and LLM providers don’t always disclose how selections are weighted. Companies often claim neutrality even when their choices say otherwise. Hiding bias doesn’t make it go away; it makes it harder to address and creates more risk when it eventually surfaces. If you aren’t transparent about your stance, someone else may define it for you.
Treat Bias As Clarity
You don’t need to frame your positioning as “our directed bias.” But you should acknowledge that when you pick an ICP, craft messaging, or optimize content for AI retrieval, you’re making deliberate choices about inclusion and exclusion. Clarity means accepting those choices, measuring their impact, and owning the direction you’ve set. That’s the difference between bias shaping you and you shaping bias.
Apply Discipline To Your AI Footprint
Just as you shape brand positioning with intent, you need to decide how you want to appear in AI systems. That means publishing content in ways that are retrievable, structured with trust markers, and aligned with your desired stance. If you don’t manage this actively, AI will still make choices about you; they just won’t be choices you controlled.
A Final Danger To Consider
Bias isn’t really a villain. Hidden bias is.
In search engines, in AI systems, and in the marketplace, bias is the default. The mistake isn’t having it. The mistake is letting it shape outcomes without realizing it’s there. You can either define your bias with intent or leave it to chance. One path gives you control. The other leaves your brand and business at the mercy of how others decide to interpret you.
And here’s a thought that occurred to me while working through this: What if bias itself could be turned into an attack vector? I’m certain this isn’t a fresh idea, but let’s walk through it anyway. Imagine a competitor seeding enough content to frame your company in a certain light, so that when an LLM compresses those inputs into an answer, their version of you is what shows up. They wouldn’t even need to name you directly. Just describe you well enough that the system makes the connection. No need to cross any legal lines here either, as today’s LLMs are really good at guessing a brand when you just describe their logo or a well-known trait in common language.
The unsettling part is how plausible that feels. LLMs don’t fact-check in the traditional sense; they compress patterns from the data available to them. If the patterns are skewed because someone has been deliberately shaping the narrative, the outputs can reflect that skew. In effect, your competitor’s “version” of your brand could become the “default” description users see when they ask the system about you.
Now imagine this happening at scale. A whisper campaign online doesn’t need to trend to have impact. It just needs to exist in enough places, in enough variations, that an AI model treats it as consensus. Once it’s baked into responses, users may have a hard time finding your side of the story.
I don’t know if that’s an actual near-term risk or just an edge-case thought experiment, but it’s worth asking: Would you be prepared if someone tried to redefine your business that way?
New data from the Audience Key content marketing platform indicates that Amazon’s visibility has suffered a significant drop. The decline follows two changes Amazon made to its presence in Google Shopping, although it is uncertain whether those changes are direct or indirect causes.
The first change was the discontinuation of its paid Shopping ads, and the second was the consolidation of its three merchant store names (Amazon, Amazon.com, and Amazon.com – Seller) into a single store identity, “Amazon.” These changes appear to have had a measurable effect on how often Amazon product cards appear in Google’s organic Shopping results.
Audience Key is a content marketing platform that fills a gap in competitive intelligence by tracking and reporting on Google’s organic product grid rankings at scale. This is a new product that has recently rolled out.
According to Audience Key:
“Across 79,000+ keywords, Audience Key’s first-of-its-kind tracking showed the effects of Amazon’s changes to its merchant feed — the approach initially wiped out 31% of its organic product card rankings. Weeks later, Amazon has now disappeared completely — creating a seismic shift that is immediately reshaping e-commerce SERPs and freeing up prime shelf space for rivals.”Tom Rusling, founder of Audience Key notified me today that Amazon has subsequently completely dropped out of the organic search results, beginning on August 18th.
Anecdotally, I’ve seen Amazon completely dropped out of Google’s organic product grids, including for search queries I know for certain they used to rank for and are now completely gone from the search engine results pages (SERPs).
Overall Impact
The most immediate change was the overall scale of Amazon’s presence. Before July 25, Amazon’s listings appeared in 428,984 organic product cards. After the change, that presence dropped to 294,983.
Before July 25: 428,984 product cards
After July 25: 294,983 product cards
Net change: -134,001 cards (31% decline)
This shows that Amazon’s move was not just a brand consolidation but also a large reduction in visibility. It is possible that the brand consolidation triggered a temporary drop in visibility because it’s such a wide-scale change.
Category-Level Changes
The reduction was not spread evenly. Some product categories were hit harder than others. Apparel had the steepest losses, while categories like Home Goods and Laptop Computers also fell sharply.
Smaller categories such as Tires and Indoor Decor declined more moderately, but all showed the same downward trend.
Apparel Category Experiences The Largest Declines
Apparel stands out as the category where Amazon saw the steepest reductions, with its presence cut by more than half across several tracked segments.
Below is the data I currently have, I’m waiting for clarification from Audience Key about whether the following apparel categories are more specific:
Apparel: 4,571 → 1,804 (-60%)
Apparel: 4,503 → 1,859 (-59%)
Apparel: 31,852 → 13,632 (-57%)
Apparel: 6,932 → 3,029 (-56%)
Several Other Major Categories Affected
The losses were also large in high-volume categories. Home Goods, Laptop Computers, and Outdoor Furnishings all saw reductions, while Business Supplies and Technology products also suffered visibility declines.
Business Supplies: 12,510 → 9,786 (-22%)
Home Goods: 133,717 → 73,833 (-45%)
Laptop Computers: 30,520 → 19,615 (-36%)
Outdoor Furnishings: 58,416 → 41,995 (-28%)
Scientific and Technology: 58,880 → 50,666 (-14%)
Smaller Categories Also Affected
Even niche verticals were affected, though the percentage losses were less severe than in Apparel or Home Goods. These declines show Amazon’s reductions were spread across both major and smaller categories.
Structures: 6,241 → 4,229 (-32%)
Tires: 3,063 → 2,609 (-15%)
Indoor Decor: 23,634 → 19,789 (-16%)
Indoor Decor (variant): 6,626 → 5,926 (-11%)
Merchant Store Consolidation
Another change came from how Amazon presented itself in Shopping results. Before July 25, the company appeared under three names: Amazon, Amazon.com, and Amazon.com – Seller. Afterward, only the unified “Amazon” label remained.
Total before consolidation (all three names): 428,984 product cards
After consolidation (single “Amazon”): 294,980 product cards
This simplified Amazon’s presence by unifying it under one name, but it also coincided with a decline in overall coverage.
Where Amazon Is At Today?
Even with the July drops in visibility, Amazon remained the most visible merchant in Google Shopping, with smaller visibility than before. But that’s not longer the case, the situation for Amazon appears to have worsened.
Audience Key speculated on what is going on:
“We thought the first chapter of this story was complete, but just as we prepared this study for publication, everything changed. Again. Our latest U.S. search data reveals a stunning shift: Amazon vanished from the organic product grids.
Whether this is a short-term anomaly or a more permanent new normal, only time will tell. We will continue to monitor and report on our findings. The sudden removal leaves us — and the industry — asking one big question: WHY???
That is certainly a topic for speculation.”
Audience Key speculates that Amazon may be withholding their product feed from Google or that this is a technical or strategic change on Amazon’s part.
One thing that we know about Google organic search is that large-scale changes can have a dramatic impact on search visibility. Audience Key has a unique product that is focused on tracking Google’s product grid, something that many ecommerce companies may find useful. They are apparently well-positioned to notice this kind of change.
Read Audience Key’s blog post about these changes:
Google has announced that the CrUX Dashboard, the Looker Studio-based visualization tool for CrUX data, will be retired at the end of November 2025. The reason given for the deprecation is that it was not designed for “wide-scale” use and that Google has developed more scalable alternatives.
Why The CrUX Dashboard Is Being Retired
The CrUX Dashboard was built in Looker Studio to summarize monthly CrUX data. It gained popularity as Core Web Vitals became the de facto standard for how developers and SEOs measured performance.
Behind the scenes, however, the tool struggled to keep up with demand. According to the official Chrome announcement, it suffered “frequent outages, especially around the second Tuesday of each month when new data was published.”
The Chrome team concluded that while the dashboard showed the value of CrUX data, it was not built on the right technology.
Transition To Better Alternatives
To address these issues, Google launched the CrUX History API, which delivered weekly instead of monthly data, allowing more frequent monitoring of trends. The History API was faster and more scalable, leading to adoption by third-party tools.
In 2024, Google introduced CrUX Vis, which was more scalable and faster. Today, in 2025, CrUX Vis receives four to five times more users than the CrUX Dashboard, showing that users are increasingly moving to the newer tool.
What the Change Means for Users
Chrome will shut down the CrUX Connector to BigQuery in late November 2025. When this connector is removed, dashboards that depend on it will stop updating. Users who want to keep the old dashboard will need to connect directly to BigQuery with their own credentials. The announcement explains that the CrUX Connector infrastructure is unreliable and requires too much monitoring to maintain, which is why investment has shifted to the History API and CrUX Vis.
Some users have asked Google to postpone the shutdown until 2026, but the announcement makes it clear that this is not an option. Although the dashboard and its connector will be retired, the underlying BigQuery dataset will continue to be updated and supported. Google stated that it sees BigQuery as a valuable, longer-term public dataset.
I’ve been extremely antsy to publish this study. Consider it the AIO Usability study 1.5, with new insights. You also want to stay tuned for our first AI Mode usability study! It’s coming in a few weeks (make sure to subscribe not to miss it).
Boost your skills with Growth Memo’s weekly expert insights. Subscribe for free!
Since March, everyone’s been asking the same question: “Are AI Overviews killing our conversions?”
Our 2025 usability study gives a clearer answer than the hot takes you’ll see on LinkedIn and X (Twitter).
In May 2025, I published significant findings from the first comprehensive UX study of AI Overviews (AIOs). Today, I’m presenting you with new insights from that study based on a cutting-edge RAG system that analyzed over 100,000 words of transcription.
The most significant, stand-out finding from that study: People use AI Overviews to get oriented and save time.
Then, for any search that involves a transaction or high-stakes decision-making, searchers validate outside Google, usually with trusted brands or authority domains.
Net-net: AIO is a preview layer. Blue links still close. Before we dive in, you need to hear these insights from Garrett French, CEO of Xofu, who financed this study:
“What lit me up most from this latest work from Kevin: We have direct insight now into an “anchor pattern” of AIO behavior.
In this usability study, we discovered that users rarely voice distrust of AI Overviews directly – instead they hesitate, refine, or click out.
Therefore, hesitation itself is the loudest signal to us.
We see the same in complex, transition-enabling purchase-committee buying (B2B and B2C): Procurement stalls without lifecycle clarity, engineer stall without specs, IT stalls without validation.
These aren’t complaints. They’re unresolved, unanswered, and even unknown questions that have NEVER shown themselves in KW demand.
As content marketers, we have never held ourselves systematically accountable to answering them.
Customer service logs – as an example of one surface for discovering friction – expose the same hesitations in traceable form through repeated chats, escalations, deployment blocks, etc.
Customer service logs are one surface; AIOs are another.
But the real source of truth is always contextual audience friction.
Answering these “friction-inducing, unasked latent questions give us a way to read those signals and design content that truly moves decisions forward.
What The Study Actually Found:
Organic results are the most trusted and most consistently successful destination across tasks.
Sponsored results are noticed but actively skipped due to low trust.
In-SERP answers quickly resolved roughly 85% of straightforward factual questions.
Users often use AIO as a preview or shortcut, then click out to finish or validate (on brand sites, YouTube, coupon portals, and the like).
Shopping carousels aid discovery more than closure. Expect reassessment clicks.
Trust splits by stakes: Low-stakes search journeys often end in the AIO, while finance or health pushes people to known authorities like PayPal, NIH, or Mayo Clinic.
Age and device matter. Younger users, especially on smartphones, accept AIOs faster; older cohorts favor blue links and authority domains.
When the AIO is wrong or feels generic, people bail. We logged 12 unique “AIO is misleading/wrong” flags in higher-stakes contexts.
(Interested in diving deeper into the first findings from this study or need a refresher? Read the first full iteration of the UX study of AIOs.)
Why This Matters For The Bottom Line
In my earlier analysis, I argued that top-of-funnel visibility had more downstream impact than our marketing analytics ever credited. I also argued that demand doesn’t just disappear because clicks shrink.
This study’s behavior patterns support that: AIO satisfies quick lookup intent, but purchase intent still routes through external validation and brand trust – aka clicks. Participants in this study shared thoughts aloud, like:
“There’s the AI results, but I’d rather go straight to PayPal’s own site.”
“Mayo Clinic at the top of results, that’s where I’d go. I trust Mayo Clinic more than an AI summary.”
And that preserves downstream conversions (when you show up in the right places and have earned authority).
Image Credit: Kevin Indig
Deeper Insights: Secondary Findings You Need To See
Recently, I worked with Eric Van Buskirk (the research director of the study) and his team over at Clickstream Solutions to do a deeper analysis of the May 2025 findings.
Using an advanced RAG-driven AI system, we analyzed all 91,559 (!) words of the transcripts from recorded user sessions across 275 task instances.
This is important to understand: We were able to find new insights from this study because Eric has built cutting-edge technology.
Our new RAG system analyzes structured fields like SERP Features, AIO satisfaction, or user reactions from transcriptions and annotations. It creates a retrieval layer and uses ChatGPT-5 for semantic search.
The result is faster, more rigorous, and more transparent research. Every claim can be traced to data rows and transcript quotes, patterns are checked across the full dataset, and visual evidence is a query away.
(To sum that all up in plain language: Eric’s custom-built advanced RAG-driven AI system is wildly cool and extremely effective.)
Practical benefits:
Auditable insights: Conclusions map back to exact data slices.
Speed: Test a hypothesis in minutes instead of re-reading sessions.
Scale: Triangulate transcripts, coded fields, and outcomes across all participants.
Fit for the AI era: Clean structure and trustworthy signals mirror how retrieval systems pick sources, which aligns with our broader stance on visibility and trust.
Here’s what we found:
The data verified four distinct AIO Intent Patterns.
Key SERP features drove more engagement than others.
Core brands shape trust in AIOs.
About The New RAG System
We rebuilt the analysis on a retrieval-augmented system so answers come from the study data, not model guesswork. The backbone lives on structured fields with full transcripts and annotations, indexed in a lightweight database and paired with bucketed data for cohort filtering and cross-checks.
Core components:
Dataset ingestion and cleaning.
Retrieval layer based on hybrid keyword + semantic search.
Auto-coded sentiment to turn speech into consistent, queryable signals.
Validation loop to minimize hallucination.
The result is faster, more rigorous, and more transparent research. Every claim can be traced to rows and quotes, patterns are checked across the full dataset, and visual evidence is a query away.
Practical benefits:
Map conclusions back to exact data slices.
Test a hypothesis in minutes.
Triangulate transcripts, coded fields, and outcomes across all participants.
Clean structure and trustworthy signals.
Which AIO Intent Patterns Were Verified Through The Data
One of the biggest secondary findings from the AIO usability study is that the AIO Intent Patterns aren’t just “gut feelings” anymore – they’re statistically validated, built from measurable behavior.
Before some of you roll your eyes and annoyingly declare “here’s yet another newly created SEO/marketing buzzword,” the patterns we discovered in the data weren’t exactly search personas, and they weren’t exactly search intents, either.
Therefore, we’re using the phrase “AIO Intent Pattern” to distinguish these concepts from one another.
Here’s how I define AIO Intent Patterns: AIO Intent Patterns represent statistically validated clusters of user behavior – like dwell, scroll, refinements, and sentiment – that define how people respond to AIOs. They’re recurring, measurable behaviors that describe how people interact with AI Overviews, whether they accept, validate, compare, or reject them.
And, again, these patterns aren’t exactly search intents or queries, but they’re not exactly user profiles either.
Instead, these patterns represent a set of behaviors (that appeared throughout our data) carried out by users to validate AIOs in different and distinct ways. So that’s why we’ve called the individual behavioral patterns “validations” below.
By running a RAG-driven coding pass across 250+ task instances, we were able to quantify four different behavioral patterns of engagement with AIOs:
Efficiency-first validations that reward clean, extractable facts (accepting of AIOs).
Trust-driven validations that convert only with credibility (validate AIOs).
Comparative validations that use AIOs but compare with multiple sources.
Skeptical rejections that automatically distrust AIOs for high-stakes queries.
What matters most here is that these aren’t arbitrary labels.
Statistical tests showed the differences in dwell time, scrolling, and refinements between the four groups were far too large to be random.
To put it plainly: These are real AIO use behavioral segments or AIO use intents you can plan for.
Let’s look at each one.
1. Efficiency-First Validations
These are validations where users intend to seek a shortcut. Users dip into AIOs for fast fact lookups, skim for one answer, and move on.
Efficiency-driven validations thrive on content that’s concise, scannable, and fact-rich. Typical queries that are resolved directly in the AIO include:
“1 cup in ml”
“how to take a screenshot on Mac”
“UTC to CET converter”
“what is robots.txt”
“email regex example”
Below, you can check out two examples of “efficiency-first validation” task actions from the study.
“Okay, so I like the summary at the top. And I would go ahead and follow these instructions and only come back to a search if they didn’t work.”
“I just had to go straight to the AI overview… and I liked that answer. It gave me the information I needed, organized and clear. Found it.”
Our data shows an average dwell time of just 14 seconds for this group overall, with almost no scrolling or refinements.
Users that have an efficiency-first intent for their queries have a neutral to positive sentiment toward AIOs – with no hesitation flags – because AIOs scratch the efficiency-intent itch quickly.
For this behavioral pattern, the AIO often is the final answer – especially on mobile – and if they do click, it’s usually the first clear, extractable source.
👉 Optimization tips for this validation group:
Compress key facts into crisp TLDRs, FAQs, and schema so AIO can surface them.
Place definitions, checklists, and example blocks near the top of your page.
Use simple tables and step lists that can be lifted cleanly.
Ensure brand mentions and key facts appear high on the page for visibility.
2. Trust-Driven Validations
These validations are full of caution. Users with trust-driven intents engage with AIOs but rarely stop there.
They’ll skim the overview, hesitate, and then click out to an authority domain to validate what they saw, like in this example below:
The user shares that “…at the top, it gave me a really good description on how to transfer money. But I still clicked the PayPal link because it was directly from the official site. That’s what I went with – I trust that information to be more accurate.”
Typical queries that trigger this validation pattern include:
“PayPal buyer protection rules”
“Mayo Clinic strep symptoms”
“Is creatine safe long term”
“Stripe refund timeline”
“GDPR consent requirements example”
And our data from the study verifies users scroll more (2.7x on average), dwell longer (~57s), and often flag uncertainty in trust-driven mode. What they want is authority.
These users have a high rate of hesitation flags in their search experiments. Their sentiment is mixed – often neutral, sometimes anxious or frustrated – and their confidence is only medium to low.
For these searches, the AIO is a starting point, not the destination. They’ll click out to Mayo Clinic, PayPal, Stripe, or other trusted domains to validate.
👉 Optimization tips for this validation group:
Reinforce trust scaffolding on your landing pages: expert reviewers, citations, and last-reviewed dates.
Mirror official terminology and link to primary sources.
Add “What to do next” boxes that align with authority guidance.
Build strong E-E-A-T signals since credibility is the conversion lever here.
3. Comparative Validations
This search intent actively leans into the AIO for classic comparative queries (think “Ahrefs vs Semrush for content teams”) to fulfill their search intent OR to compare informational resources to get clarity on the “best” of something; they expand, scroll, refine, and use interactive features – but they don’t stop there.
Instead, they explore across multiple sources, hopping to YouTube reviews, Reddit threads, and vendor sites before making a decision.
Example queries that reveal AIO comparative validation behavior:
“Notion vs Obsidian for teams”
“Best mirrorless camera under 1000”
“How to change a bike tire”
“Standing desk benefits vs risks”
“Programmatic SEO examples B2B”
“How to install a nest thermostat”
Here’s an example using a “how to” search, where the user is comparing sources for the best way to receive the most accurate information:
“The AI Overview gave me clear step-by-step instructions that matched what I expected. But since it was a physical DIY task, I still preferred to branch out to watch a video for confirmation.”
On average, searchers looking for comparative validations in the AIO dwell for 45+ seconds, scroll 4-5 times, and often open multiple tabs.
Their AIO sentiment is positive, and their confidence is high, but they still want to compare.
If this feels familiar – like classic transactional or commercial search intents – it’s because it is related.
If you’ve been doing SEO for any time, it’s likely you’ve created some of these “versus” or “comparison” pages. You also have likely created “how to” content with step-by-step how-to guidance, like how to install a flatscreen TV on your wall.
Before AIOs, your target users would find themselves there if you ranked well in search.
But now, the AIO frames the landscape first, and the decision comes after weighing pros and cons across information sources to find the best solution.
👉 Optimization tips for this validation group:
Publish structured comparison pages with decision tables and use-case breakdowns.
Pair each page with short demo videos, social proof, and credible community posts to echo your takeaways.
Include “Who it is for” and “Who it isn’t for” sections to reduce ambiguity.
Seed content in YouTube and forums that AIOs (and users) can pick up.
4. Skeptical Rejections
Searchers with a make-or-break intent? They’re the outright AIO skeptical rejectors.
When stakes are high – health, finance, or legal … the typical YMYL (Your Money, Your Life) stuff – they don’t trust AIO to get it right.
Users may scan the summary briefly, but they quickly move to authoritative sources like government sites, hospitals, or financial institutions.
Common queries where this rejection pattern shows up:
“Metformin dosage for PCOS”
“How to file taxes as a freelancer in Germany”
“Credit card chargeback rights EU”
“Infant fever when to go to ER”
“LLC vs GmbH legal liability”
For this search intent, the dwell time in an AIO is short or nonexistent, and their sentiment often skews negative.
They show determination to bypass the AI layer in favor of direct authority validation.
👉 Optimization tips for this validation group:
Prioritize citations and mentions from highly trusted domains so AIOs lean on you indirectly.
Align your pages with the language and categories used by official sources.
Add explicit disclaimers and clear subheadings to strengthen authority signals.
For YMYL topics, focus on being cited rather than surfaced as the final answer.
SERP Features That Drove Engagement
Our RAG AI-driven system of the usability data verified that not all SERP features are created equal.
When we cut the data down to only features with meaningful engagement – which our study defined as ≥5 seconds of dwell time across at least 10 instances – only four SERP features findings stood out.
(I’ll give you a moment to take a few wild guesses regarding the outcomes … and then you’ll see if you’re right.)
Drumroll please. 🥁🥁🥁
(Okay, moment over. Here we go.)
1. Organic Results Are Still The Backbone
Whenever our study participants gave the classic blue links more than a passing glance, they almost always found success.
Transcripts from the study make it explicit: Users trusted official sites, government domains, and familiar authority brands, as one participant’s quote demonstrates:
“Mayo Clinic at the top of results, that’s where I’d go. I trust Mayo Clinic more than an AI summary.”
What about social or community sites that showed up in the organic blue-link results?
Reddit and YouTube were the social or community platforms found in the SERP that were mentioned most by study participants.
Reddit had 45 unique mentions across the entire study. Overall, seeing a Reddit result in organic results produces a user sentiment that is mostly positive, with some users feeling neutral toward the inclusion of Reddit in search, and very few negative comments about Reddit results.
YouTube had 20 unique mentions across the entire study. The sentiment toward YouTube inclusion in SERP results was overwhelmingly positive (19 out of 20 of those instances had a positive user sentiment). The emotions flagged from the study participants around YouTube results included happy/satisfied or curious/exploring.
There was a very clear theme across the study that appeared when social or community sites popped up in organic results:
Reddit was invoked when participants wanted community perspective, usually in comparison tasks. Confidence was high because Reddit validated nuance, but AIO trust was weak (users bypassed AIOs to Reddit instead).
YouTube was used as a visual validator, especially in product or technical comparison tasks. Users expressed positive sentiment and high satisfaction, even when explicit trust wasn’t verbalized. They treated YouTube as a natural step after the AIOs/organic SERP results.
2. Sponsored Results Barely Register
People saw them, but rarely acted on them. “I don’t like going to sponsored sites” was a common refrain.
High visibility, but low trust.
3. Shopping Carousels Aid Discovery But Not Closure.
Participants clicked into Shopping carousels for product ideas, but often bounced back out to reassess with external sites.
The carousel works as a catalog – not a closer.
4. Featured Snippets Continue To Punch Above Their Weight
For straightforward factual lookups, Snippets had an ~85% success rate of engagement.
They were efficient and final for fact-based queries like [example] and [example].
⚠️ Important note:Even though Google is replacing Featured Snippets with AIOs, it’s clear that this method of receiving information within the SERP has a high engagement. While the SERP feature may be in the process of being discontinued, the data shows users like engaging with snippets. The takeaway here is that if you were often appearing for featured snippets and you’re now often appearing for AIO citations, keep up the good work to continue earning visibility there, because it still matters.
SERP Features x AIO Intent Patterns
When you keep the intent pattern layers in mind with different persona groups, it makes the search behaviors sharper:
Younger users on mobile leaned heavily on AIO and snippets, often stopping there if the stakes were low. → That’s the hallmark of efficiency-first validations (quick fact lookups) and comparative validations (scrolling, refining, and treating AIO as the main lens).
Older users consistently bypassed AI elements in favor of organic authority results. → This is classic behavior for trust-driven validations, when users click out to brands like PayPal or the Mayo Clinic, and skeptical rejections, when users distrust AIO altogether for high-stakes tasks.
Transactional queries – money, health, booking – nearly always pushed people toward trusted brands, regardless of what AIO or ads surfaced. → This connects directly to trust-driven validations (users who need authority reinforcement to fulfill their search intent) and skeptical rejections (users who reject AIO in YMYL contexts because AIOs don’t meet the intent behind the behavior).
What this shows is that, for SEOs, the priority isn’t about chasing every feature and “winning them all.”
Take this as an example:
“The AI overview didn’t pop up, so I used the search results. These were mostly weird websites, but CNBC looked trustworthy. They had a comparison of different platforms like CardCash and GCX, so I went with CNBC because they’re a trusted source.”
Your job is to match intent (as always):
Earn extractable presence in AIOs for quick facts,
Reinforce trust scaffolding on authority-driven organic pages, and
Treat Shopping and Sponsored slots as visibility and awareness plays rather than conversion levers.
Which Brands Shaped Trust In AIOs
AIOs don’t stand on their own; they borrow credibility from the brands they surface – whether you like it or not.
Emerging platforms (Raise, CardCash, GameFlip, Kade Pay) gained traction primarily because an AIO surfaced them, not because of prior awareness.
👉 Why it matters: Brand trust is the glue between AIO exposure and user action.
Here’s a quick paraphrase of this user’s exploration: We’re looking for places to sell gift cards for instant payment. Platforms like Raise, Gift Card Granny, or CardCash come up. On CardCash, I tried a $10 7-Eleven card, and the offer was $8.30. So they ‘tax’ you for selling. That’s good to know – but it shows you can sell gift cards for cash, and CardCash is one option.
In this instance, the AIO surfaced CardCash. The user didn’t know about it before this search. They explored it in detail, but trust friction (“they tax you”) shaped whether they’d actually use it.
For SEOs, this means three plays running in tandem:
Win mentions in AIOs by ensuring your content is structured, scannable, and extractable.
Strengthen authority off-site so when users validate (or reject the AIO), they land on your pages with confidence.
Build topical authority in your niche through comprehensive persona-based topic coverage and valuable information gain across your topics. (This can be a powerful entry point or opportunity for teams competing against larger brands.)
What does this all mean for your own tactical optimizations?
But here’s the most crucial thing to take away from this analysis today:
With this information in mind, you can now go to your stakeholders and guide them to look at all your prompts, queries, and topics with fresh eyes.
You need to determine:
Which of the target queries/topics are quick answers?
Which of the target queries/topics are instances where people need more trust and assurance?
When do your ideal users expect to explore more, based on the target queries/topics?
This will help you set expectations accordingly and measure success over time.
Featured Image: Paulo Bobita/Search Engine Journal
In my previous article, “Closing the Digital Performance Gap,” I made the case that web effectiveness is a business issue, not a marketing metric. The website is no longer just a reflection of your brand – it is your brand. If it’s not delivering measurable business results, that’s a leadership problem, not a team problem.
But there’s a deeper issue underneath that: Who actually owns web performance?
The truth is, many companies don’t have a good answer. Or they think they do until something breaks. The SEO team doesn’t own the infrastructure. The dev team isn’t briefed on platform changes. The content team isn’t looped in until after a redesign. Visibility drops, conversions dip, and someone asks, “Why isn’t our SEO team performing?”
Because they don’t own the full system, no one does.
If we want to close the digital performance gap, we must address this root problem: lack of accountability.
The Fallacy Of Distributed Ownership
The idea that “everyone owns the website” likely stems from early digital transformation initiatives, where cross-functional collaboration was encouraged to break down departmental silos. The intent was to foster shared responsibility across departments – but the unintended consequence was diffused accountability.
It sounds collaborative, but in practice, it often means no one is fully accountable for performance.
Here’s how it typically breaks down:
IT owns infrastructure and hosting.
Marketing owns content and campaigns.
SEO owns visibility – but not implementation.
UX owns experience – but not findability.
Legal owns compliance – but limits usability.
Product owns the content management system (CMS) – but doesn’t track SEO.
Each group is doing its job, often with excellence. But the result? Disconnected execution. Strategy gets lost in translation, and performance stalls.
Case in point: For a global alcohol brand, a site refresh had legal requirements mandating an age verification gate before users could access the site. That was the extent of their specification. IT built the gate exactly to spec: a page with the statement to enter your birthdate and three pull-down options for Month, Day, and Year, and a check of that date to the U.S. legal drinking age. UX and creative delayed launch for weeks while debating the optimal wording, positioning, and color scheme.
Once launched, the website traffic, both direct and organic search, dropped to zero. This was due to several key reasons:
Analytics were not set up to track visits before and after the age gate.
Search engines can’t input a birthdate, so they were blocked.
The age requirement was set to the U.S. standard, rejecting younger, yet legal visitors from other countries.
Because everything was done in silos, no one had considered these critical details.
When we finally got all stakeholders in a room, agreed on the issues, and sorted through them, we redesigned the system:
Search engines were recognized and bypassed the age requirement.
The age requirement and date format are adapted to the user’s location.
UX developed multiple variations and tested abandonment.
Analytics captured pre- and post-gate performance.
UX used the data to validate new landing page formats.
The result? A compliant, user-friendly, and search-accessible module that could be reused globally. Visibility, conversions, and compliance all increased exponentially. But we lost months and millions in potential traffic simply because no one owned the whole picture.
Without centralized accountability, the site was optimized in parts but underperforming as a whole.
The AI Era Raises The Stakes
This kind of siloed ownership might have been manageable in the old “10 blue links” era. But in an AI-first world – where Google and other platforms synthesize content into answers, summarize brands, and bypass traditional click paths – every decision across your digital operation impacts your visibility, trust, and conversion.
Search visibility today depends on structured data, crawlable infrastructure, content relevance, and citation-worthiness. If even one of these is out of alignment, you lose shelf space in the AI-driven SERP. And chances are, the team responsible for the weak link doesn’t even know they’re part of the problem.
Why Most SEO Advice Falls Short
I’ve seen well-meaning advice to “improve your SEO strategy” fall flat – because it assumes the SEO team has control over all the necessary elements. They don’t.
You can’t fix crawl issues if you can’t talk to the dev team.
You can’t win AI citations if your content team doesn’t structure or enrich their pages.
You can’t build authority if your legal or PR teams strip bios and outbound references.
To create sustained performance, companies need to designate real ownership over web effectiveness. That doesn’t mean centralizing every task – but it does mean centralizing accountability.
Here are three practical approaches:
1. Establish A Digital Center Of Excellence (CoE)
A CoE provides governance, guidance, and support across business units and regions. It ensures that:
Standards are defined and enforced.
Platforms are chosen and maintained with shared goals.
Think of this like a Commissioning Authority in construction – a role that ensures every component works together to meet the original performance spec. A DEO:
Connects the dots between dev, SEO, UX, and content.
Advocates for platform investment and cross-team prioritization.
3. Build Shared KPIs Across Departments
Most teams optimize for what they’re measured on. If the SEO team is judged on rankings but not revenue, and the content team is judged on output but not visibility, you get misaligned efforts. Create chained KPIs that reflect end-to-end performance.
Characteristics Of A Performance-Driven Model
Companies that close the accountability gap tend to share these traits:
Unified Taxonomy and Tagging – so content is findable and trackable.
Structured Governance – clear roles and escalation paths across teams.
Shared Dashboards – everyone sees the same numbers, not vanity metrics.
Tech Stack Discipline – fewer, better tools with cross-functional usage.
Scenario Planning – AI, zero-click SERPs, and platform volatility are modeled, not ignored.
Final Thought: Performance Requires Ownership
If you’re serious about web effectiveness, you need more than skilled people and good tools. You need a system where someone is truly accountable for how the site performs – across traffic, visibility, UX, conversion, and AI resilience.
This doesn’t mean a top-down mandate. It means orchestrated ownership with clear roles, measurable outcomes, and a strategic anchor.
It’s time to stop asking the SEO team to fix what they don’t control.
It’s time to build a framework where the web is everyone’s responsibility – and someone’s job.
Let’s make web performance a leadership priority, not a guessing game.
Google removed outdated structured data documentation, but instead of returning a 404 response, they have chosen to redirect the old URLs to a changelog that links to the old URL, thereby causing an infinite loop between the two pages. Although that is technically not a soft 404, it is an interesting use of a 301 redirect for a missing web page and not how SEOs typically handle missing web pages and 404 server responses. Did Google make a mistake?
Google Removed Structured Data Documentation
Google quitely published a changelog note announcing they had removed obsolete structured data documentation. An announcement was made three months ago in June and today they finally removed the obsolete documentation.
The missing pages are for the following structured data that is no longer supported:
Course info
Estimated salary
Learning video
Special announcement
Vehicle listing.
Those pages are completely missing. Gone, and likely never coming back. The usual procedure in that kind of situation is to return a 404 Page Not Found server response. But that’s not what is happening.
Instead of a 404 response Google is returning a 301 redirect back to the changelog. What makes this setup somewhat weird is that Google is linking back to the missing web page from the changelog, which then redirects back to the changelog, creating an infinite loop between the two pages.
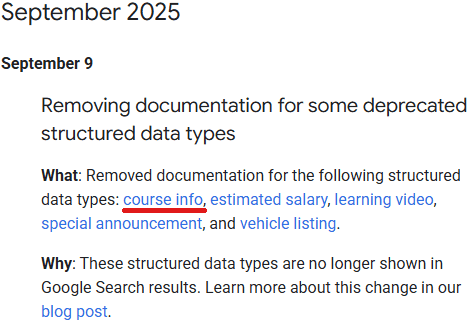
Screenshot Of Changelog
In the above screenshot I’ve underlined in red the link to the Course Info structured data.
The words “course info” are a link to this URL: https://developers.google.com/search/docs/appearance/structured-data/course-info
Which redirects right back to the changelog here: https://developers.google.com/search/updates#september-2025
Which of course contains the links to the five URLs that no longer exist, essentially causing an infinite loop.
It’s not a good user experience and it’s not good for crawlers. So the question is, why did Google do that?
301 redirects are an option for pages that are missing, so Google is technically correct to use a 301 redirect. However, 301 redirects are generally used to point “to a more accurate URL” which generally means a redirect to a replacement page, one that serves the same or similar purpose.
Technically they didn’t create a soft 404. But the way they handled the missing pages creates a loop that sends crawlers back and forth between a missing web page and the changelog. It seems that it would have been a better user and crawler experience to instead link to the June 2025 blog post that explains why these structured data types are no longer supported rather than create an infinite loop.
I don’t think it’s anything most SEOs or publishers would do, so why does Google think it’s a good idea?
For multi-location brands, local search has always been competitive. But 2025 has introduced a new player: AI.
From AI Overviews to Maps Packs, how consumers discover your stores is evolving, and some brands are already pulling ahead.
Robert Cooney, VP of Client Strategy at DAC, and Kyle Harris, Director of Local Optimization, have spent months analyzing enterprise local search trends. Their findings reveal clear gaps between brands that merely appear and those that consistently win visibility across hundreds of locations.
Multi-generational search habits are shifting. Brands that align content to real consumer behavior capture more attention.
The next wave of “agentic search” is coming, and early preparation is the key to staying relevant.
This webinar is your chance to see these insights in action. Walk away with actionable steps toprotect your visibility, optimize local presence, and turn AI-driven search into a growth engine for your stores.
📌 Register now to see how enterprise brands are staying ahead of AI in local search. Can’t make it live? Sign up and we’ll send the recording straight to your inbox.
The way people find and consume information has shifted. We, as marketers, must think about visibility across AI platforms and Google.
The challenge is that we don’t have the same ability to control and measure success as we do with Google and Microsoft, so it feels like we’re flying blind.
Earlier this year, Google, Microsoft, and ChatGPT each commented about how structured data can help LLMs to better understand your digital content.
Structured data can give AI tools the context they need to determine their understanding of content through entities and relationships. In this new era of search, you could say that context, not content, is king.
Schema Markup Helps To Build A Data Layer
By translating your content into Schema.org and defining the relationships between pages and entities, you are building a data layer for AI. This schema markup data layer, or what I like to call your “content knowledge graph,” tells machines what your brand is, what it offers, and how it should be understood.
This data layer is how your content becomes accessible and understood across a growing range of AI capabilities, including:
AI Overviews
Chatbots and voice assistants
Internal AI systems
Through grounding, structured data can contribute to visibility and discovery across Google, ChatGPT, Bing, and other AI platforms. It also prepares your web data to be of value to accelerate your internal AI initiatives as well.
The same week that Google and Microsoft announced they were using structured data for their generative AI experiences, Google and OpenAI announced their support of the Model Context Protocol.
You can think of MCP as the USB-C connector for AI applications and agents or an API for AI. “MCP provides a standardized way to connect AI models to different data sources and tools.”
Since we are now thinking of structured data as a strategic data layer, the problem Google and OpenAI need to solve is how they scale their AI capabilities efficiently and cost-effectively. The combination of structured data you put on your website, with MCP, would allow accuracy in inferencing and the ability to scale.
Structured Data Defines Entities And Relationships
LLMs generate answers based on the content they are trained on or connected to. While they primarily learn from unstructured text, their outputs can be strengthened when grounded in clearly defined entities and relationships, for example, via structured data or knowledge graphs.
Structured data can be used as an enhancer that allows enterprises to define key entities and their relationships.
When implemented using Schema.org vocabulary, structured data:
Defines the entities on a page: people, products, services, locations, and more.
Can reduce hallucinations when LLMs are grounded in structured data through retrieval systems or knowledge graphs.
When schema markup is deployed at scale, it builds a content knowledge graph, a structured data layer that connects your brand’s entities across your site and beyond.
A recent study by BrightEdge demonstrated that schema markup improved brand presence and perception in Google’s AI Overviews, noting higher citation rates on pages with robust schema markup.
Structured Data As An Enterprise AI Strategy
Enterprises can shift their view of structured data beyond the basic requirements for rich result eligibility to managing a content knowledge graph.
According to Gartner’s 2024 AI Mandates for the Enterprise Survey, participants cite data availability and quality as the top barrier to successful AI implementation.
By implementing structured data and developing a robust content knowledge graph you can contribute to both external search performance and internal AI enablement.
A scalable schema markup strategy requires:
Defined relationships between content and entities: Schema markup properties connect all content and entities across the brand. All page content is connected in context.
Entity Governance: Shared definitions and taxonomies across marketing, SEO, content, and product teams.
Content Readiness: Ensuring your content is comprehensive, relevant, representative of the topics you want to be known for, and connected to your content knowledge graph.
Technical Capability: Cross-functional tools and processes to manage schema markup at scale and ensure accuracy across thousands of pages.
For enterprise teams, structured data is a cross-functional capability that prepares web data to be consumed by internal AI applications.
What To Do Next To Prepare Your Content For AI
Enterprise teams can align their content strategies with AI requirements. Here’s how to get started:
1. Audit your current structured data to identify gaps in coverage and whether schema markup is defining relationships within your website. This context is critical for AI inferencing.
2. Map your brand’s key entities, such as products, services, people, and core topics, and ensure they are clearly defined and consistently marked up with schema markup across your content. This includes identifying the main page that defines an entity, known as the entity home.
3. Build or expand your content knowledge graph by connecting related entities and establishing relationships that AI systems can understand.
4. Integrate structured data into AI budget and planning, alongside other AI investments and that content is intended for AI Overviews, chatbots, or internal AI initiatives.
5. Operationalize schema markup management by developing repeatable workflows for creating, reviewing, and updating schema markup at scale.
By taking these steps, enterprises can ensure that their data is AI-ready, inside and outside the enterprise.
Structured Data Provides A Machine-Readable Layer
Structured data doesn’t assure placement in AI Overviews or directly control what large language models say about your brand. LLMs are still primarily trained on unstructured text, and AI systems weigh many signals when generating answers.
What structured data does provide is a strategic, machine-readable layer. When used to build a knowledge graph, schema markup defines entities and the relationships between them, creating a reliable framework that AI systems can draw from. This reduces ambiguity, strengthens attribution, and makes it easier to ground outputs in fact-based content when structured data is part of a connected retrieval or grounding system.
By investing in semantic, large-scale schema markup and aligning it across teams, organizations position themselves to be as discoverable in AI experiences as possible.
When Judge Amit P. Mehta issued his long-awaited remedies decision in the Google search antitrust case, the industry exhaled a collective sigh of relief. There would be no breakup of Google, no forced divestiture of Chrome or Android, and no user-facing “choice screen” like the one that reshaped Microsoft’s browser market two decades ago. But make no mistake – this ruling rewrites the playbook for search distribution, data access, and competitive strategy over the next six years.
This article dives into what led to the decision, what it actually requires, and – most importantly – what it means for SEO, PPC, publishers, and the emerging generation of AI-driven search assistants.
What Led To The Decision
The Department of Justice and a coalition of states sued Google in 2020, alleging that the company used exclusionary contracts and massive payments to cement its dominance in search. In August 2024, Judge Mehta ruled that Google had indeed violated antitrust law, writing, “Google is a monopolist, and it has acted as one to maintain its monopoly.” The question then became: what remedies would actually restore competition?
The DOJ and states pushed for sweeping measures – including a breakup of Google’s Chrome browser or Android operating system, and mandatory choice screens on devices. Google countered that such steps would harm consumers and innovation. By the time remedies hearings wrapped, generative AI had exploded into the mainstream, shifting the court’s sense of what competition in search could look like.
Exclusive contracts banned. Google can no longer strike deals that make it the sole default search engine on browsers, phones, or carriers. That means Apple, Samsung, Mozilla, and mobile carriers can now entertain offers from rivals like Microsoft Bing or newer AI entrants.
Payments still allowed. Crucially, the court did not ban Google from paying for placement. Judge Mehta explained that removing payments altogether would “impose substantial harms on distribution partners.” In other words, the checks will keep flowing – but without exclusivity.
Index and data sharing. Google must share portions of its search index and some user interaction data with “qualified competitors” on commercial terms. Ads data, however, is excluded. This creates a potential on-ramp for challengers, but it doesn’t hand them the secret sauce of Google’s ranking systems.
No breakup, no choice screen. Calls to divest Chrome or Android were rejected as overreach. Similarly, the court declined to mandate a consumer-facing choice screen. Change will come instead through contracts and UX decisions by distribution partners.
Six-year oversight. Remedies will be overseen by a technical committee for six years. A revised judgment is due September 10, with remedies taking effect roughly 60 days after final entry.
As Judge Mehta put it, “Courts must… craft remedies with a healthy dose of humility,” noting that generative AI has already “changed the course of this case.”
How The Market Reacted
Investors immediately signaled relief. Alphabet shares jumped ~8% after hours, while Apple gained ~4%. The lack of a breakup, and the preservation of lucrative search placement payments, reassured Wall Street that Google’s search empire was not being dismantled overnight.
But beneath the relief lies a new strategic reality: Google’s moat of exclusivity has been replaced with a marketplace for defaults.
Strategic Insights: Beyond The Headlines
Most coverage of the decision has focused on what didn’t happen – the absence of a breakup or a choice screen. But the deeper story is how distribution, data, and AI will interact under the new rules.
1. Defaults Move From Moat To Marketplace
Under the old model, Google’s exclusive deals ensured it was the default on Safari, Android, and beyond. Now, partners can take money from multiple providers. That turns the default position into a marketplace, not a moat.
Apple, in particular, gains leverage. Court records revealed that Google paid Apple $20 billion in 2022 and paid $26.3 billion in 2021 – the figure is not to any one company, but Apple likely represents the largest recipient – to remain Safari’s default search engine. Without exclusivity, Apple can entertain bids from Microsoft, OpenAI, or others – potentially extracting even more money by selling multiple placements or rotating defaults.
We may see new UX experiments: rotating search tiles, auction-based setup flows, or AI assistant shortcuts integrated into operating systems. Distribution partners like Samsung or Mozilla could pilot “multi-home defaults,” where Google, Bing, and an AI engine all coexist in visible slots.
2. Data Access Opens An On-Ramp For Challengers
Index-sharing and limited interaction data access lower barriers for rivals. Crawling the web is expensive; licensing Google’s index could accelerate challengers like Bing, Perplexity, or OpenAI’s rumored search product.
But it’s not full parity. Without ads data and ranking signals, competitors must still differentiate on product experience. Think faster answers, vertical specialization, or superior AI integration. As I like to put it: Index access gives challengers legs, not lungs.
Much depends on how “qualified competitor” is defined. A narrow definition could limit access to a token few; a broad one could empower a new wave of vertical and AI-driven search entrants.
3. AI Is Already Shifting The Game
The court acknowledged that generative AI reshaped its view of competition. Assistants like Copilot, Gemini, or Perplexity are increasingly acting as intent routers – answering directly, citing sources, or routing users to transactions without a traditional SERP.
That means the battle for distribution may shift from browsers and search bars to AI copilots embedded in operating systems, apps, and devices. If users increasingly ask their assistant instead of typing a query, exclusivity deals matter less than who owns the assistant.
For SEO and SEM professionals, this accelerates the shift toward zero-click answers, assistant-ready content, and schema that supports citations.
Yes, investors cheered. But over time, Google could face rising traffic acquisition costs (TAC) as Apple, Samsung, and carriers auction off default positions. Defending its distribution may get more expensive, eating into margins.
At the same time, without a choice screen, search market share is likely to shift gradually, not collapse. Expect Google’s U.S. query share to remain in the high 80s in the near term, with only single-digit erosion as rivals experiment with new models.
5. Knock-On Effects: The Ad-Tech Case Looms
Don’t overlook the second front: the DOJ’s separate antitrust case against Google’s ad-tech stack, now moving toward remedies hearings in Virginia. If that case results in structural changes – say, forcing Google to separate its publisher ad server from its exchange – it could reshape how search ads are bought, measured, and monetized.
For publishers, both cases matter. If rivals gain traction with AI-driven assistants, referral traffic could diversify – but also become more volatile, depending on how assistants handle citations and click-throughs.
What Happens Next
September 10, 2025: DOJ and Google file a revised judgment.
~60 days later: Remedies begin taking effect.
Six years: Oversight period, with ongoing compliance monitoring.
Key Questions To Watch:
How will Apple implement non-exclusive search defaults in Safari?
Who qualifies as a “competitor” for index/data access, and on what terms?
Will rivals like Microsoft, Perplexity, or OpenAI buy into distribution slots aggressively?
How will AI assistants evolve as distribution front doors?
What This Means For SEO And PPC
This ruling isn’t just about contracts in Silicon Valley – it has practical consequences for marketers everywhere.
Distribution volatility planning. SEM teams should budget for a world where Safari queries become more contestable. Test Bing Ads, Copilot Ads, and assistant placements.
Assistant-ready content. Optimize for concise, cite-worthy answers with schema markup. Publish FAQs, data tables, and source-friendly content that large language models (LLMs) like to quote.
Syndication hedge. If new index-sharing programs emerge, explore partnerships with vertical search startups. Early pilots could deliver traffic streams outside the Google ecosystem.
Attribution resilience. As assistants mediate more traffic, referral strings will get messy. Double down on UTM governance, server-side tracking, and marketing mix models to parse signal from noise.
Creative testing. Build two-tier content: a punchy, fact-dense abstract that assistants can lift, and a deeper explainer for human readers.
Market Scenarios
Base Case (Most Likely): Google retains high-80s market share. TAC costs rise gradually. AI assistants siphon a modest share of informational queries by 2027. Impact: margin pressure more than market share loss.
Upside for Rivals: If index access is broad and AI assistants nail UX, Bing, Perplexity, and others could win five to 10 points combined in specific verticals. Impact: SEM arbitrage opportunities emerge, and SEO adapts to answer-first surfaces.
Regulatory Cascade: If the ad-tech remedies impose structural changes, Google’s measurement edge narrows, and OEMs test choice-like UX voluntarily. Impact: more fragmentation, more testing for marketers.
Final Takeaway
Judge Mehta summed up the challenge well: “Courts must craft remedies with a healthy dose of humility.” The ruling doesn’t topple Google, but it does force the search giant to compete on more open terms. Exclusivity is gone; auctions and assistants are in.
For marketers, the message is clear: Don’t wait for regulators to rebalance the playing field. Diversify now – across engines, assistants, and ad formats. Optimize for answerability as much as for rankings. And be ready: The real competition for search traffic is just beginning.