A woman’s uterus has been kept alive outside the body for the first time
<div data-chronoton-summary="
- A uterus survived outside the body for the first time: Scientists in Spain kept a donated human uterus alive for 24 hours using a machine that mimics the body’s circulatory system, pumping modified blood through the organ.
- The researchers hope to someday keep a uterus alive for a full menstrual cycle: Researchers also want to study how embryos implant into the uterine lining, by observing the process in a living organ outside the body.
- Bigger ambitions are already on the table: The team’s founder envisions a future where a machine like this could gestate a human fetus entirely outside the body, offering a new path to parenthood for those unable to carry a pregnancy.
” data-chronoton-post-id=”1134766″ data-chronoton-expand-collapse=”1″ data-chronoton-analytics-enabled=”1″>
“Think of this as a human body,” says Javier González.
In front of me is essentially a metal box on wheels. Standing at around a meter in height, it reminds me of a stainless-steel counter in a restaurant kitchen. It is covered in flexible plastic tubing—which act as veins and arteries—connecting a series of transparent containers, the organs of this machine.
What makes it extra special is the role of the cream-colored tub that sits on its surface. Ten months ago, González, a biomedical scientist who developed the device with his colleagues at the Carlos Simon Foundation, carefully placed a freshly donated human uterus in the tub. The team connected it to the device’s tubes and pumped in modified human blood.
The device kept the uterus alive for a day—a new feat that could represent the first step to the long-term maintenance of uteruses outside the human body. The work has not yet been published.
The team members want to keep donated human uteruses alive long enough to see a full menstrual cycle. They hope this will help them study diseases of the uterus and learn more about how embryos burrow their way into the organ’s lining at the start of a pregnancy. They also hope that future iterations of their device might one day sustain the full gestation of a human fetus.
The machine is technically called PUPER, which stands for “preservation of the uterus in perfusion.” But González’s colleague Xavier Santamaria says the team has adopted a nickname for it: “We call it ‘Mother.’”
The organ in the machine
González and Santamaria, medical vice president of the Carlos Simon Foundation, demonstrated how the device might work when I visited the foundation in Valencia, Spain, earlier this month (although it held no organs on that day).
Both are interested in learning more about implantation, the moment at which an embryo attaches itself to the lining of a uterus—essentially, the very first moment of pregnancy.
The foundation’s founder and director, Carlos Simon, believes it’s a sticking point in IVF: Scientists have made many improvements to the technology over the years, but the failure of embryos to implant underlies plenty of unsuccessful IVF cycles, he says. Being able to carefully study how the process works in a real, living organ might give the team a better idea of how to prevent those failures.
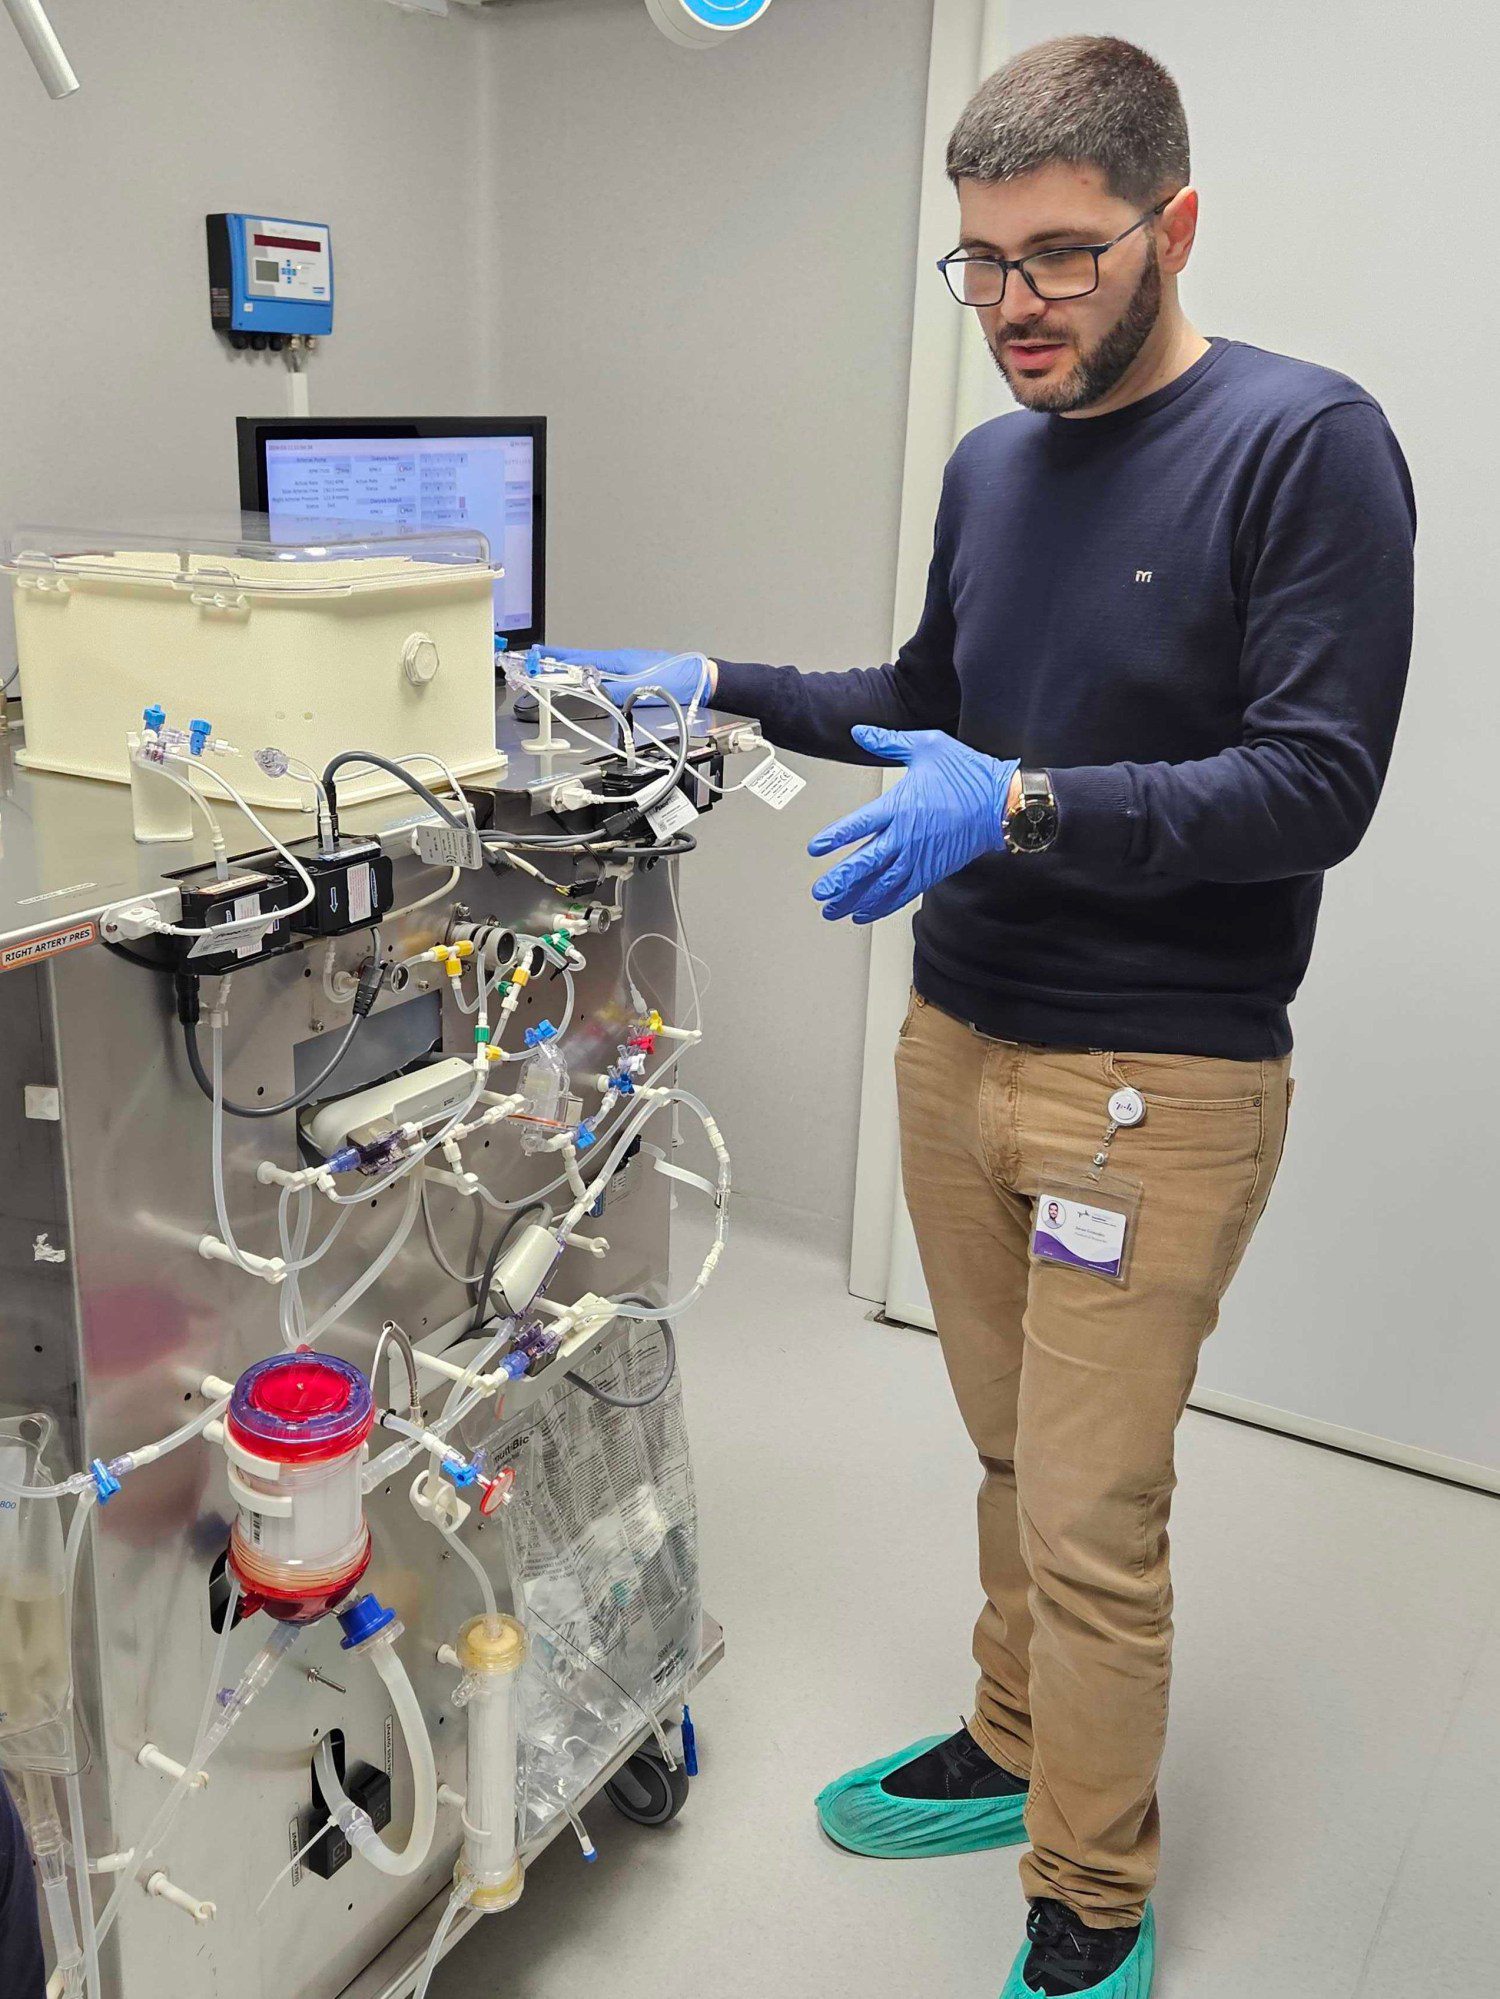
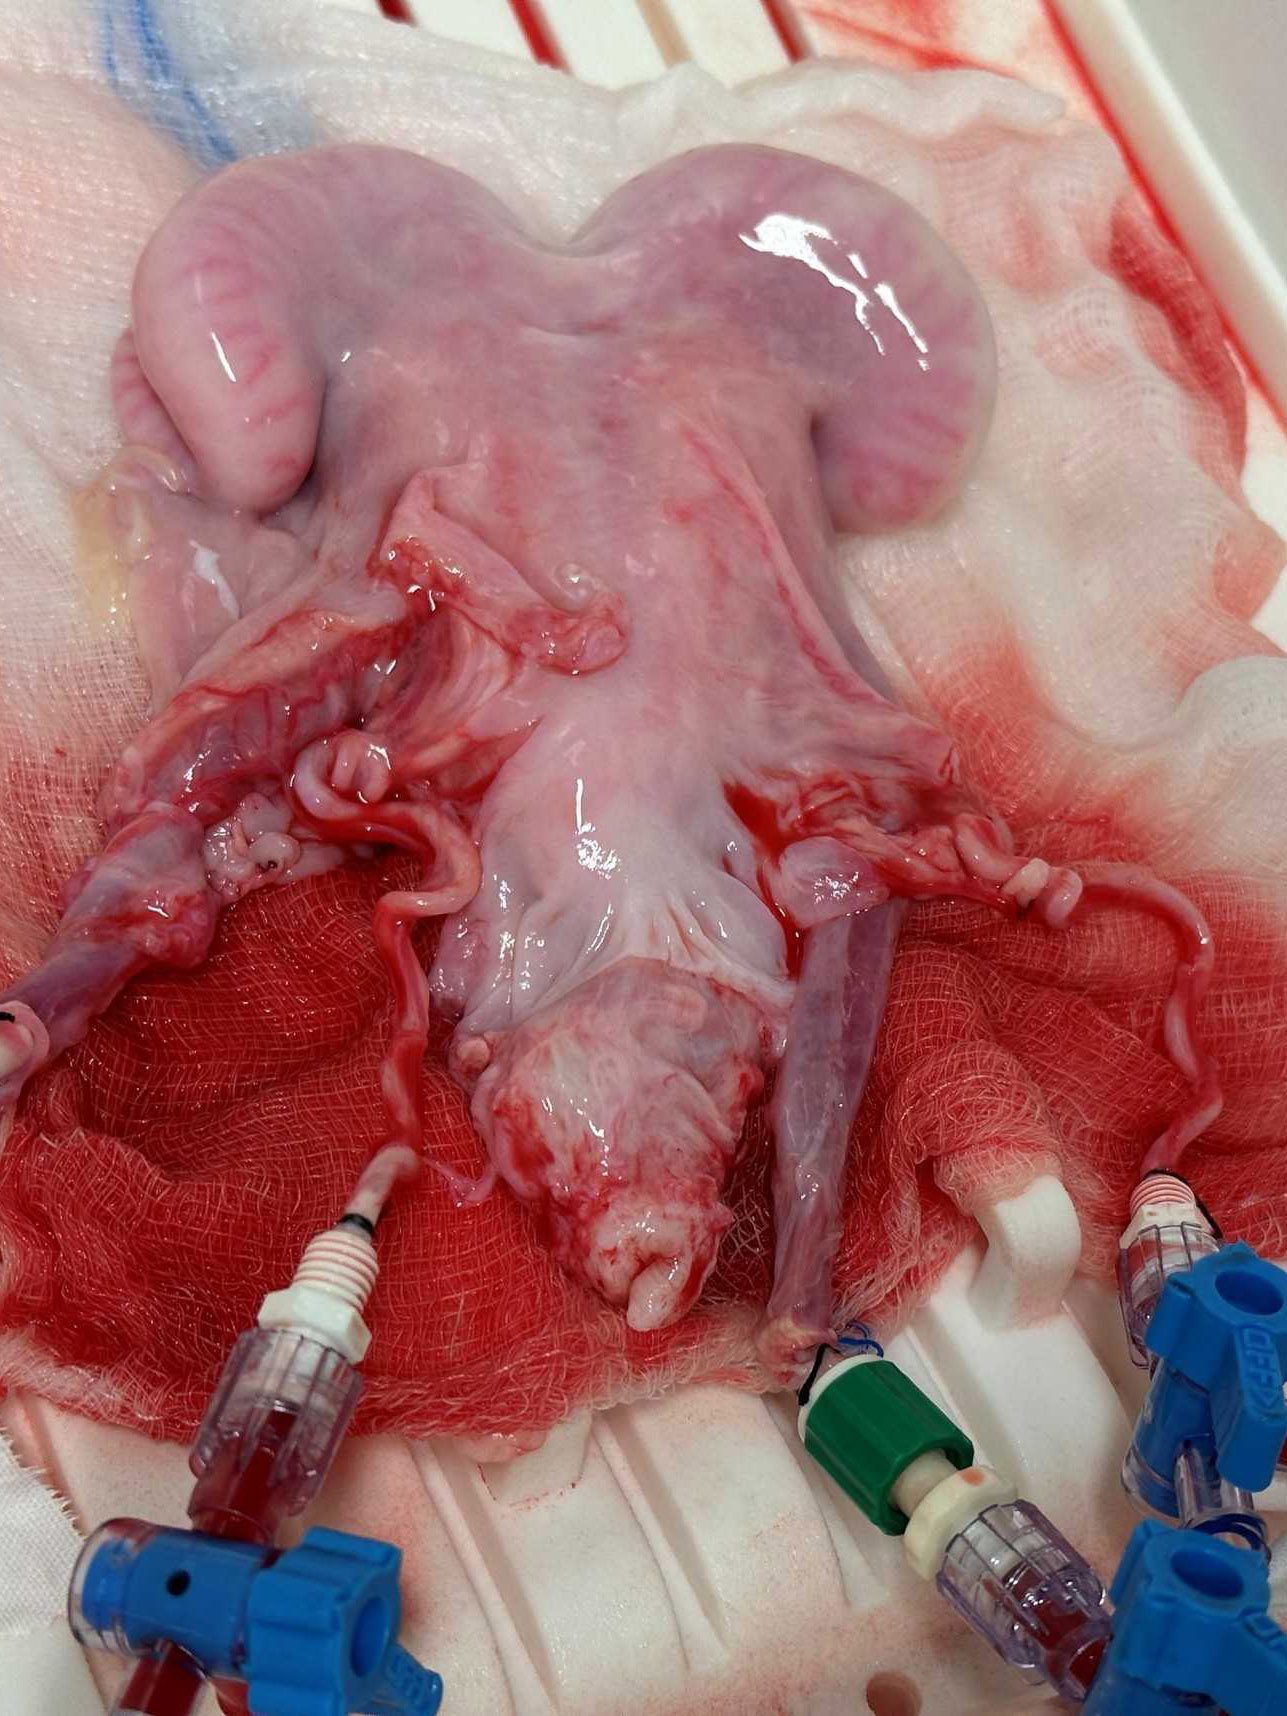
Javier González demonstrates the perfusion machine. A previous iteration of the device kept a sheep’s uterus (right) alive for a day.
The team took inspiration from advances in technologies designed to maintain donated organs for transplantation. In recent years, researchers around the world have created devices that deliver nutrients and filter waste so that organs can survive longer after being removed from donors’ bodies.
The main goal here is to buy time. A human organ might last only a matter of hours outside the body, so a transplant may require frantic preparation for the recipient, sometimes in the middle of the night. With a little more time, doctors could find better donor-patient matches and potentially test the quality of donated organs.
This approach is called normothermic or machine perfusion, and it is already being used clinically for some liver, kidney, and heart transplants.
The team at the Carlos Simon Foundation built a similar machine for uteruses. A blood bag hangs on one side. From there, blood is ferried via plastic tubing to a pump, which functions as the heart. The pump shunts the blood through an oxygenator, which adds oxygen and removes carbon dioxide as the lungs would in a human body.
The blood is warmed and passed through sensors that monitor the levels of glucose and oxygen, along with other factors. It passes through a “kidney” to remove waste. And finally the blood reaches the uterus, hooked up to its own plastic “arteries” and “veins.” The organ itself sits at a tilt, just as in the body, and is kept in a humid environment to stay moist.
Mother’s first uterus
The team first began testing an early prototype of the device with sheep uteruses around four years ago. That meant carting the machine to an animal research center in Zaragoza, around 200 miles away. Over the course of the preliminary study, veterinary surgeons removed the uteruses of six sheep and hooked them up to the machine. They kept each uterus alive for a day, using blood from the same animals.
After the sheep experiments, the researchers carted their machine back to Valencia and modified it to achieve its current incarnation, “Mother.” They started working with a local hospital that performed hysterectomies. And in May last year, they were offered their first human uterus.
The team needed to be quick. “You need to put [the uterus in the machine] within a couple of hours, maximum, of the extraction,” says Santamaria. He and his colleagues also needed to connect the uterus’s blood vessels to the tubing delicately, taking care to avoid any blockages (clotting is a major challenge in organ perfusion). The organ was hooked up to human blood obtained from a blood bank.
It seemed to work—at least temporarily. “We kept it alive for one day,” says Santamaria.
“As a proof of concept, it is impressive,” says Keren Ladin, a bioethicist who has focused on organ transplantation and perfusion at Tufts University. “These are early days.”
It might not sound like much, but 24 hours is a long time for an organ to be out of the body. Maintaining a donated uterus for that long could expand the options for uterus transplant, a fairly new procedure offered to some people who want to be pregnant but don’t have a functional uterus, says Gerald Brandacher, professor of experimental and translational transplant surgery at the Medical University of Innsbruck in Austria.
“It is better than what we currently have, because we have only a couple of hours,” he says. So far, most uterus transplants have been planned operations involving organs from living donors. A technology like this could allow for the use of more organs from deceased donors, he says.
That work is “not in the immediate pipeline” for the team in Spain, says Santamaria. “We are working on other problems.”
Pregnancy in the lab?
Santamaria, González, and their colleagues are more interested in using sustained human uteruses for research.
They’ve mounted a camera to a wall in the corner of the room, pointed at their machine. It allows the team to monitor “Mother” remotely, and to check if any valves disconnect. (That happened once before—a spike in pressure caused the blood bag to come loose, spilling a liter of blood on the floor, Santamaria says.)
They’d like to be able to keep their uteruses alive for around 28 days to study the menstrual cycle and disorders that affect the uterus, like endometriosis and fibroids.
It won’t be easy to maintain a uterus for that long, cautions Brandacher. As far as he knows, no one has been able to maintain a liver for more than seven days. “No studies out there … have shown 30-day survival in a machine perfusion circuit,” he says.
But it’s worth the effort. The team’s main interest is learning more about how embryos implant in the uterine lining at the start of a pregnancy. They hope to be able to test the process in their outside-the-body uteruses.
They won’t be allowed to use human embryos for this, says González—that would cross an ethical boundary. Instead, they plan to use embryo-like structures made from stem cells. The structures closely resemble human embryos but are created in a lab without sperm or eggs.
Simon himself has grander ambitions.
He sees a future in which a machine like “Mother” will be able to fully gestate a human, all the way from embryo to newborn. It could offer a new path to parenthood for people who don’t have a uterus, for example, or who are not able to get pregnant for other reasons.
He appreciates that it sounds futuristic, to say the least. “I don’t know if we will end up having pregnancies inside of the uterus outside of the body, but at least we are ready to understand all the steps to do that,” he says. “You have to start somewhere.”