The 10 Best PPC Ad Networks via @sejournal, @LisaRocksSEM
Choosing the right pay-per-click (PPC) ad network is a core strategy impacting the success of your advertising program.
Each network reaches distinct audiences, offers different ad formats, and suits different campaign objectives, from capturing high-intent search demand to driving awareness through video and social feeds. With AI-powered automation now embedded across most major platforms, understanding what each network does well (and where it falls short) matters more than ever.
In this article, we compare 10 of the leading PPC ad networks available today, covering each platform’s reach, audience demographics, ad formats, unique features, AI integration, and advertiser best fit to help you decide where to invest your budget.
Note: While we refer to the following as “PPC” ad networks, each offers multiple pricing options for pay-per-click, impressions, video views, or conversions. We are exploring popular paid media ads.
1. Google Ads
Google Ads is the most popular ad network due to the immense reach of its ads and its broad range of users. As the world’s leading search engine, Google offers a variety of opportunities for advertisers.
It uses search and the power of the websites on the Google Display Network (GDN), which consists of more than 2 million websites, videos, and apps on which display ads can appear.
Audience targeting on the display network is commonly used for brand awareness, retargeting, and top-of-funnel lead generation.
Both search and display campaigns allow demographic targeting by age, gender, parental status, and household income.
Adding in demographic targeting narrows the available reach for ads, but makes the targeting more relevant.
- Reach: Largest PPC network with billions of daily searches and extensive reach through Google Search, YouTube, Discover, Maps, and the Google Display Network.
- Demographics: Broad and diverse, all-age groups, genders, and interests globally.
- Ad Formats: Text ads, Responsive ads, Image ads, App Promotion ads, Video ads, Product Shopping ads, and Call-only ads.
- Unique Features: Extensive reach through Google Search, YouTube, and Google Display Network, robust targeting and analytics, deep AI integration, and optimizations.
- AI Integration: Unified machine learning powers Smart Bidding, Performance Max automation, real-time auction optimization, and AI Max for Search across Google properties.
- Advertiser best fit: Best for reaching a broad audience with high-intent traffic, flexible targeting, and detailed performance insights.

2. Microsoft Ads
Bing comes in as the second-largest search engine worldwide, behind Google. Despite being in second place, it has an impressive 23.36 billion monthly PC searches on the Bing search engine.
The Microsoft Audience Network serves display and native ads. You’ll find remarketing, in-market, customer match, similar audiences, LinkedIn audiences, and more opportunities in the Microsoft Audience Network.
Through its partnership with Yahoo, Microsoft Advertising powers search ads across Bing, Yahoo, and other syndicated partners. Its search network also extends to Microsoft-owned properties such as Edge, Windows, and Ouredtlook, and it supports LinkedIn-based audience targeting, including company, industry, and job function data. Bing also powers web results for some voice assistants.
Microsoft Ads offers advertisers campaign import capabilities from Google Ads, simplifying the process of getting started and managing campaigns across platforms while maintaining consistency.
- Reach: Significant volume through Bing, Yahoo and AOL search engines, reaching users across Microsoft-owned and partner properties.
- Demographics: Microsoft Advertising reports a broad search audience, with a large share of users (73%) under 45 and a relatively balanced gender split. According to Microsoft, over one-third of users hold a college degree, more than one-third fall into the top household income quartile, and many are part of family households.
- Ad Formats: App Install ads, Expanded Text ads, Dynamic Search ads, Microsoft Advertising in Bing Smart Search, Audience ads, Multimedia ads, Product ads, Responsive Search ads, and Vertical ads.
- Unique Features: Integration with Bing, Yahoo, and AOL, competitive cost-per-click rates, and LinkedIn profile targeting.
- AI Integration: Machine learning supports automated bidding, audience expansion, and delivery optimization across Search and the Microsoft Audience Network, with Copilot assisting campaign creation and optimization workflows.
- Advertiser best fit: Advertisers targeting working professionals and household decision-makers, including families with higher disposable income. Performs well for B2B, services, and considered purchases, especially in desktop-first environments and Microsoft-owned products.

3. Meta Ads
Meta Ads allows businesses to reach highly targeted audiences across Facebook and Instagram, using large-scale engagement and intent signals to support precise ad delivery. The platform has increasingly shifted away from manual targeting toward automation that optimizes delivery based on user behavior and conversion likelihood.
Audience targeting includes demographics, interests, behaviors, and engagement signals. Meta supports retargeting through on-platform activity and off-site actions using the Meta Pixel and customer list uploads.
- Reach: Meta’s advertising ecosystem spans Facebook, Instagram, Messenger, and WhatsApp. Facebook alone reports over 3.07 billion monthly active users, while Instagram reports around 3 billion monthly active users, offering large-scale reach across Meta’s platforms.
- Demographics: According to DataReportal, Facebook’s ad audience includes 2.28 billion people globally. The analysis suggests that the average age of Facebook users in 2025 falls between 25 and 34 years old, with male users aged 25-34 representing the largest share of active Facebook users during that period.
- Ad Formats: Image ads, Video ads, Carousel ads, Collection ads, Stories ads, and Ads in Explore.
- Unique Features: Broad placement coverage across Meta properties, creative flexibility designed for mobile-first environments, and automation through Advantage+ Shopping and campaign optimization tools.
- AI Integration: Machine learning powers Advantage+ automation, optimizing audience expansion, placements, budget allocation, and creative delivery in real time across Meta properties.
- Advertiser Best Fit: Well-suited for ecommerce, direct-to-consumer, and brand-led advertisers seeking scale through short-form video and feed-based experiences, particularly for upper- and mid-funnel demand creation.

4. LinkedIn Ads
LinkedIn reports that over 1.2 billion professionals use LinkedIn (including 98% of Fortune 500 CEOs) and that 78% of B2B leaders say that “demonstrating ROI is more critical now than ever before.”
LinkedIn reports that 75% of B2B buyers use social media to make purchasing decisions, with 50% using LinkedIn as a trusted source in that process. This provides advertisers with access to a verified professional audience that possesses twice the average web audience’s buying power.
- Reach: Global network of professionals across nearly every industry, company size, and seniority level, with strong penetration among decision-makers and influencers.
- Demographics: Primarily professional audiences, including business decision-makers.
- Ad Formats: Sponsored Content, Sponsored Messaging, Lead Gen Forms, and Text and Dynamic ads.
- Unique Features: Professional targeting by job title, company, industry, seniority, and skills, along with native lead generation and account-based marketing capabilities.
- AI Integration: Machine learning supports automated bidding, audience expansion, and delivery optimization, with AI-driven relevance scoring and performance prediction across Sponsored Content and Lead Gen campaigns.
- Advertiser Best Fit: Best suited for B2B marketers focused on lead generation, account-based marketing, and reaching verified decision-makers for high-consideration products and services.

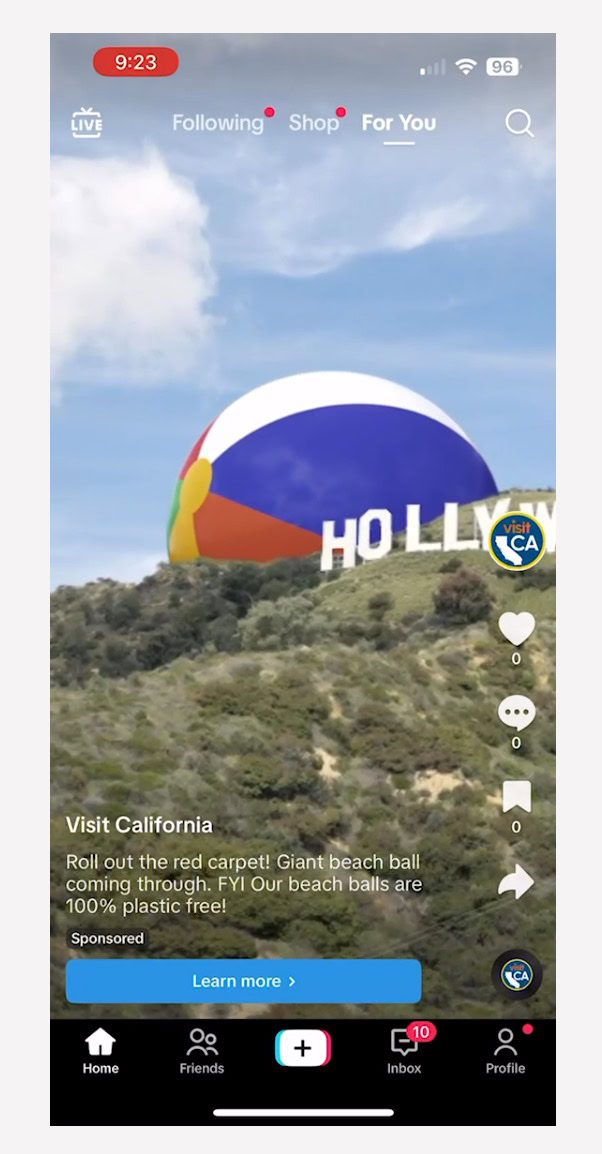
5. TikTok Ads
TikTok has quickly become one of the most influential social media platforms, particularly among younger audiences. The short-form video app has reshaped how users discover content and has created new opportunities for brands to reach audiences through immersive, entertainment-driven ads.
With its emphasis on creativity, trends, and algorithmic discovery, TikTok offers advertisers a paid ads platform built around engagement rather than explicit intent.
- Volume: Over 1.6 billion monthly active users worldwide.
- Demographics: Skews younger, with a strong concentration among Gen Z and Millennials, and a highly engaged, diverse global user base. According to the Pew Research Center, TikTok usage is especially high among younger adults in the United States, with roughly half of 18- to 29-year-olds using the platform daily.
- Ad Formats: In-Feed ads, TopView, Branded Mission, Spark Ads, and Promote.
- Unique Features: Algorithm-driven content discovery, trend-based ad formats, and native short-form video experiences designed for mobile engagement.
- AI Integration: Machine learning drives content recommendation, ad delivery, automated bidding, and Smart Performance Campaigns, optimizing ads based on engagement and conversion signals.
- Advertiser Best Fit: Best suited for brands targeting Gen Z and Millennials through awareness and demand creation, especially those able to lean into short-form video, trends, and creator-style creative.
6. Amazon Advertising
Amazon Advertising is a powerful paid ads platform for ecommerce and retail brands that leverages Amazon’s massive shopping ecosystem. It reaches consumers at the point of purchase, making it especially effective for driving direct sales and product visibility.
- Volume: Amazon reported $213.4 billion in net sales in Q4 2025, indicating substantial ecommerce transaction volume. This provides advertisers with access to high-intent shoppers actively researching and comparing products.
- Demographics: Gen Z is a key demographic for the platform.
- Ad Formats: Sponsored Products, Sponsored Brands, Brand Stores, Amazon Live, Video and Audio ads, Display ads, Out-of-home ads, and Device ads.
- Unique Features: Product and keyword-based targeting tied directly to shopping behavior, with ads appearing alongside search results, product detail pages, and related placements.
- AI Integration: Machine learning powers automated bidding, shopper relevance modeling, and performance optimization, adjusting bids and delivery in real time based on conversion likelihood and purchase signals.
- Advertiser Best Fit: Ideal for ecommerce and retail advertisers focused on driving direct sales, particularly brands with established product listings seeking to capture high-intent shoppers close to purchase.

7. X Ads (Formerly Twitter Ads)
X Ads provides advertisers with opportunities to reach users through its real-time social platform, which is heavily centered around news, live events, and cultural conversations.
Campaigns on X are structured around objectives such as awareness, consideration, and conversions, and ads are delivered across both desktop and mobile environments. Targeting includes demographics and audiences, even with the option to target conversion topics.
Promoted ads are highly flexible, supporting combinations of text, images, video, and carousels, with optional calls to action such as app installs or website clicks embedded directly within the ad creative.
- Volume: 561 million monthly active users globally.
- Demographics: As of February 2025, X’s global audience skews younger, with 37.5% aged 25-34 and 32.1% aged 18-24.
- Ad Formats: Promoted Ads, Vertical Video Ads, X Amplify, X Takeovers, X Live, Dynamic Product Ads, Collection Ads, and X Ad Features.
- Unique Features: Real-time conversation targeting, trend-based placements, and the ability to promote posts, accounts, and events as they happen.
- AI Integration: Machine learning supports automated bidding, interest and conversation targeting, and delivery optimization to align ads with real-time engagement signals and trending topics.
- Advertiser Best Fit: Best suited for brands promoting timely content, live events, launches, and cultural moments, where real-time visibility and conversation-driven engagement are critical.

8. Pinterest Ads
Pinterest is a visual discovery platform where users actively search for inspiration, ideas, and products. Unlike traditional social networks, Pinterest users often arrive with planning and purchase intent, making it a strong environment for discovery-driven advertising.
Pinterest is a strong performer for lifestyle and planning-focused brands, with success stories from advertisers in home decor, fashion, beauty, and food.
- Volume: Over 600 million monthly active users worldwide.
- Demographics: Pinterest’s audience is 70% female, with strong representation among 18-44 year-olds and a growing Gen Z segment, which now makes up 42% of users.
- Ad Formats: Standard Image ad, Quiz ad, Showcase ad, Premiere Spotlight, Idea ad, Collections, Carousel ad, Max-width Video ad, and Standard Video ad.
- Unique Features: Visual search and discovery, intent-driven browsing, and native shopping integrations that surface products during inspiration and planning moments.
- AI Integration: Machine learning powers personalized recommendations, automated bidding, and shopping relevance, matching ads to user interests based on search, save, and engagement behavior.
- Advertiser Best Fit: Well-suited for brands in lifestyle, retail, and ecommerce categories looking to influence consideration and purchase through visual inspiration and discovery.

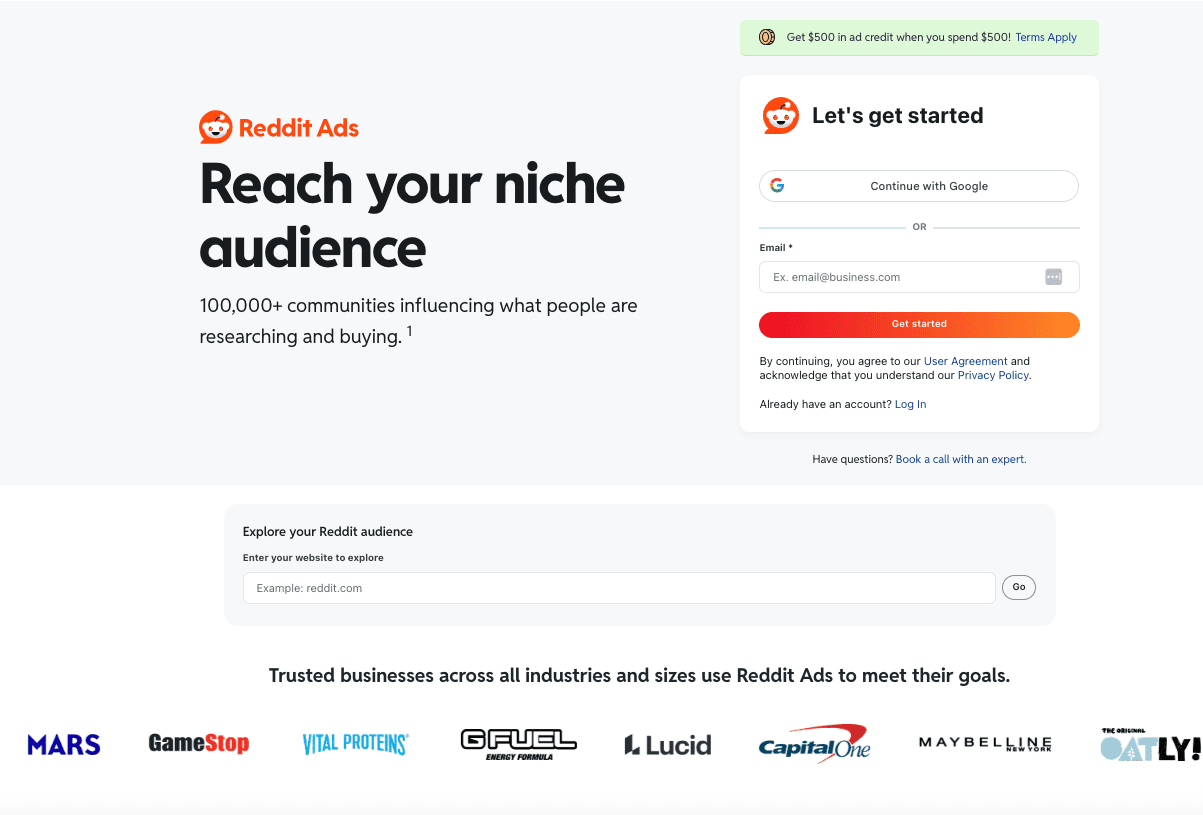
9. Reddit Ads
Reddit Ads allows advertisers to reach highly engaged audiences within over 100,000 topic-specific communities where users actively discuss interests, problems, and purchasing decisions. With subreddits covering nearly every industry and niche, Reddit offers a context-driven environment that is fundamentally different from traditional social platforms.
Rather than passive scrolling, Reddit users participate in conversations, making the platform especially valuable for brands that want to align messaging with authentic discussions and intent signals.
- Volume: 116 million daily active unique visitors across thousands of interest-based communities.
- Demographics: Reddit’s audience skews younger, with the majority of users aged 18-34. According to Pew Research, adults under 30 are among the platform’s most active users, and its audience is known for strong interest in tech and niche communities.
- Ad Formats: Free-form ads, Image ads, Video ads, Carousel ads, Conversation ads, Product ads, and AMA.
- Unique Features: Community-based targeting through subreddits, keyword and interest targeting, and placements that blend into discussion feeds.
- AI Integration: Machine learning supports automated bidding, contextual ad placement, and delivery optimization by aligning ads with relevant conversations, topics, and engagement patterns.
- Advertiser Best Fit: Best suited for brands seeking awareness, consideration, and engagement within specific interest communities, particularly for products or services that benefit from education, discussion, or social proof.

10. Apple Search Ads
Apple Search Ads allows advertisers to promote apps directly within the App Store, reaching users at the moment they are actively searching for and discovering new apps. The platform is built around high-intent queries, making it especially effective for driving app installs and user acquisition on iOS devices.
Because ads appear natively within App Store search results, Apple Search Ads offers a brand-safe environment with clear user intent and strong performance for mobile-first advertisers.
- Volume: Global reach across the App Store, with 800 million weekly visitors searching for apps across iOS devices.
- Demographics: iOS users span a broad age range. Apple’s platform policies prevent targeting users under 18, and advertisers often associate iOS users with high mobile engagement and above-average purchasing power.
- Ad Formats: Today Tab ads, Search Tab ads, Search Results ads, and Product Pages ads.
- Unique Features: Native App Store placements, keyword-based targeting, and direct integration with app metadata and search behavior.
- AI Integration: Machine learning supports automated bidding, relevance matching, and Search Match, which uses AI to align ads with relevant search queries based on app metadata and user intent signals.
- Advertiser Best Fit: Ideal for app developers and mobile advertisers focused on driving high-quality installs, subscriptions, or in-app actions within the iOS ecosystem.

Choosing The Best Ad Platforms For Your Business
Choosing the right paid advertising platforms directly impacts business growth. Each of these PPC ad networks we’ve explored in this article offers unique audiences, ad features, and opportunities to engage with your audience across the web. The key is understanding where your audience shows intent, how they engage with content, and what influences their decisions at each stage of the funnel.
The right choice for your business will depend on your business type, target audience, and marketing goals. Some platforms excel at capturing high-intent demand, while others are better suited for discovery, consideration, or demand creation.
As you evaluate your options, focus on matching platforms to user behavior, campaign objectives, and the level of automation you are prepared to manage. Once campaigns are live, ongoing optimization based on performance data is what drives long-term success.
More Resources:
Featured Image: Darko 1981/Shutterstock