Google has released an update to its Publisher Tag Ads Library, introducing a new feature to improve Interaction to Next Paint (INP) scores.
The update focuses on yielding during out-of-viewport ad slot insertions when using Single Request Architecture (SRA).
INP Improvement: Focus On Ad Loading Efficiency
The new feature allows for more strategic ad loading, particularly for ad slots not immediately visible to users.
The ad library prioritizes more immediate content and interactions by yielding to these out-of-viewport insertions, potentially improving INP scores.
Gilberto Cocchi was first to notice this update:
Google Publisher Tag Ads Library just released an INP specific improvement Yielding on out of viewport ad slots insertions via SRA. Publishers can also decide to yield on every slot including the in-viewport ones by using the adYield Config option. pic.twitter.com/ODpe3tkC0D
Google has also introduced an adYield Config option, giving publishers additional control over ad loading behavior.
This setting allows publishers to extend yielding to all ad slots, including those within the viewport, offering more flexibility in managing site performance.
Potential Impact On INP Scores
The update may affect INP scores, a Core Web Vital metric that measures page responsiveness to user interactions.
Lower INP scores generally indicate better performance, which can influence search engine rankings and user experience.
Upcoming August CrUX Report
The full impact of this update will become more apparent with the release of the next Chrome User Experience (CrUX) report, expected on September 10th.
This report will provide data on INP measurements across websites using the updated Google Publisher Tag Ads Library.
It should provide concrete data on how this update affects real-world INP scores.
INP’s Relevance For Publishers
Since its introduction as a Core Web Vital, INP has become an important metric.
It reflects a site’s responsiveness to user actions and can influence user engagement.
As Google continues emphasizing page experience in ranking systems, INP improvements could affect search visibility.
Implementing The New Feature
Publishers can access this new functionality by updating their Google Publisher Tag implementation.
The adYield Config options are detailed in the library’s documentation. Google advises testing various configurations to determine the best setup for individual site needs.
This update to the Google Publisher Tag Ads Library represents efforts needed to address the balance between ad delivery, site performance, and user experience in digital publishing.
FAQ
How does the new Google Publisher Tag Ads Library update improve Interaction to Next Paint (INP) scores?
This update improves smart ad loading, especially for ads off-screen. It prioritizes visible content and user interactions to boost INP scores, potentially helping SEO.
The new adYield Config lets publishers extend ad-yielding to all ad slots, including visible ones, for better performance control.
What is the adYield Config option, and how does it benefit publishers?
Google’s new adYield Config setting gives publishers better control over ad loading. It extends yield to all ad slots, even those immediately visible.
Key benefits:
More ad loading control
Flexible performance management
Potential UX and page responsiveness boost
This could indirectly improve INP scores and search visibility.
What is the potential impact of the Google Publisher Tag Ads Library update on INP scores?
This update aims to boost INP scores by delaying ad insertions outside the visible screen area. Better INP scores mean more responsive pages, which can impact search rankings and user experience. Publishers who use this update might see better search visibility.
The full impact will be shown in the next CrUX report, due September 10th.
Choosing the right website builder may depend on your goals. They have a variety of features, and some platforms excel in areas that others don’t.
Not all builders will fit if you need advanced SEO or ecommerce capabilities.
We compared 10 website builders based on price, data limits, core use cases, and whether they provide domains.
The 10 Best Website Builders Compared
Website Builder
Starting Price
Free Option
Premium Content Gates
Limits
Free Domain
Great For
Extras We Like
WordPress.com
$9/month
Yes
Yes
1-50 GB
Yes (annual plans only)
Blogging and text-based sites
Easily work between the .com and self-hosted sites.
Customizability.
Wix
$17/month
Yes
Yes
2 GB-Unlimited
Yes
Small businesses & entrepreneurs
Educational programs and support.
Scheduling.
Ad management.
Email campaigns.
Duda
$25/month
14 days
Yes
1-4 sites
No
Getting started
Excellent help and support.
Zapier integration.
Multiple language sites.
Content library and free assets.
HubSpot
$15/month
Yes
Yes
Up to 30 pages on the free plan
No
Scaling
Conversational bots.
Wide range of free tools for sales, marketing, and services.
Extensive site and business owner education.
Mobile app.
Squarespace
$25/month
14 days
Yes
Unlimited bandwidth, 30 minutes of video storage
Yes (annual plans only)
Quick, no-fuss sites
Custom product creation without worrying about fulfillment and shipping.
Integrated ecommerce on larger plans.
Webflow
$18/month
Yes
Yes
Starts with 1 GB bandwidth and 50 CMS items
Yes
Designers & Agencies
Schema markup and structured search support.
Pre-built interactions.
IONOS
$6/month
No
No
50-75 GB
Yes
Small businesses on a budget
Affordable.
Competitor tracking.
Online booking included.
Built-in privacy and SSL.
Shopify
$5/month
3 days
No
Unlimited products, bandwidth, and online storage
No
Ecommerce
Wide range of ecommerce features.
Large app store for extensions.
Weebly
$12/month
Yes
No
Unlimited storage
Yes
Beginners
Ease of use.
Built-in SEO tools.
Hostinger
$2.99/month
No
No
25,000 visits, 100 GB SSD storage, 400,000 files
Yes
Budget sites
Very affordable plans.
24/7 customer support.
10 Best Website Builders For 2024
1. WordPress.com
Screenshot from WordPress.com, June 2024
With 62.7% of the market share held between WordPress.com and .org, WordPress is the largest and most prominent website builder.
Key Features
Over 50,000 plugins and 8,000 themes for customization.
Ability to transition between hosted and self-hosted options.
With paid plans, custom domains, site security, and advanced features are available.
Benefits & SEO Highlights
User-friendly interface suitable for beginners.
Flexibility to create various types of websites.
Built-in SEO tools and options to optimize your site for search engines.
Cost
$0-$70/month ($0-$45/month, billed annually), plus custom options.
2. Wix
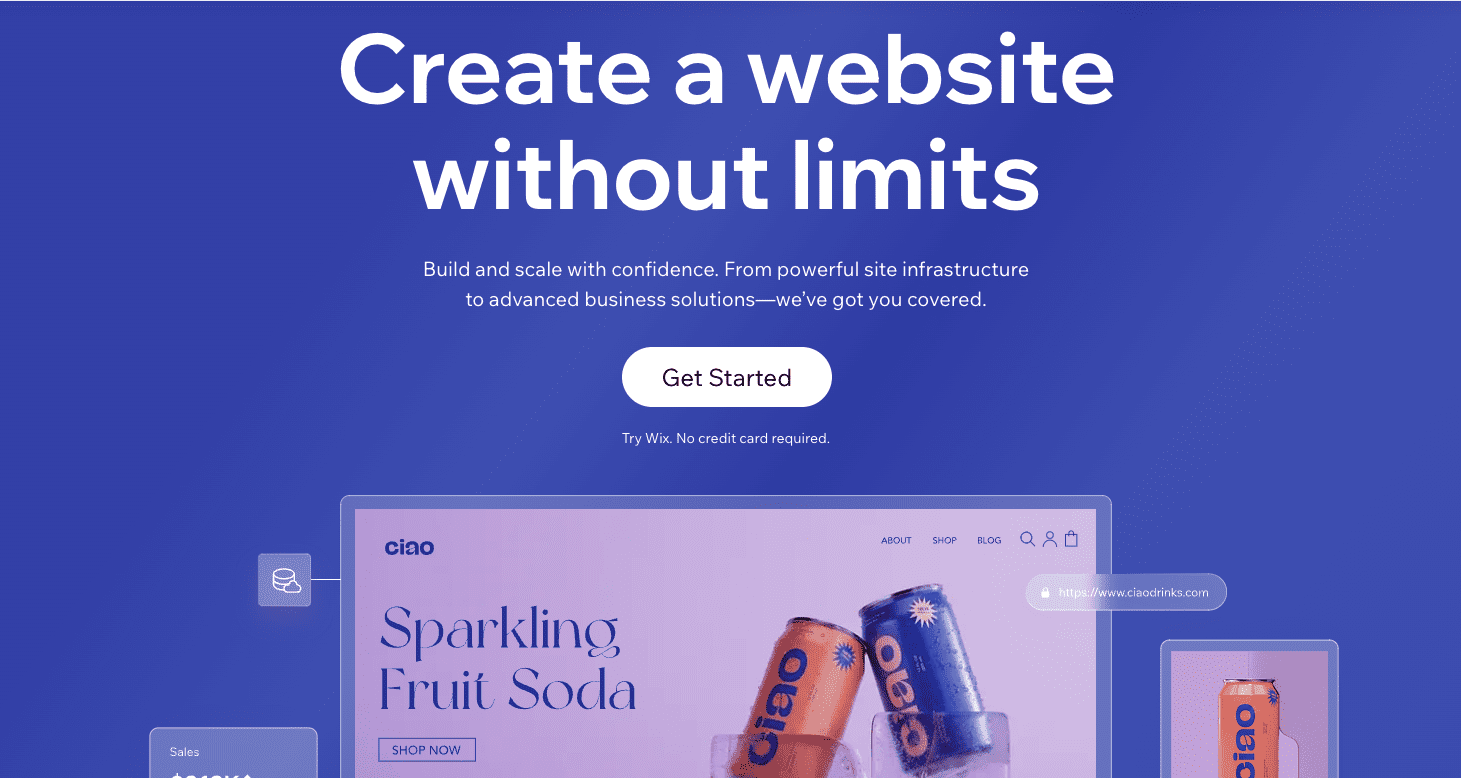
Screenshot from Wix.com, June 2024
Wix controls only 4% of the CMS market, but that small number translates into hundreds of millions of users and makes it one of the most popular website builders.
It offers ease of use and flexibility, making it suitable for creating professional websites with expanded functionality.
Key Features
Customizable templates with drag-and-drop editing.
Wide range of elements and third-party apps for added functionality.
Comprehensive business solutions, including ecommerce and marketing tools.
Benefits & SEO Highlights
Suitable for beginners and those needing advanced features.
Schema.org is a collection of vocabulary (or schemas) used to apply structured data markup to web pages and content. Correctly applying schema can improve SEO outcomes through rich snippets.
Structured data markup is translated by platforms such as Google and Microsoft to provide enhanced rich results (or rich snippets) in search engine results pages or emails. For example, you can markup your ecommerce product pages with variants schema to help Google understand product variations.
Schema.org is an independent project that has helped establish structured data consistency across the internet. It began collaborating with search engines such as Google, Yahoo, Bing, and Yandex back in 2011.
The Schema vocabulary can be applied to pages through encodings such as RDFa, Microdata, and JSON-LD. JSON-LD schema is preferred by Google as it is the easiest to apply and maintain.
Does Schema Markup Improve Your Search Rankings?
Schema is not a ranking factor.
However, your webpage becomes eligible for rich snippets in SERPs only when you use schema markup. This can enhance your search visibility and increase CTR on your webpage from search results.
Schema can also be used to build a knowledge graph of entities and topics. Using semantic markup in this way aligns your website with how AI algorithms categorize entities, assisting search engines in understanding your website and content.
“Most webmasters are familiar with HTML tags on their pages. Usually, HTML tags tell the browser how to display the information included in the tag. For example,
Avatar
tells the browser to display the text string “Avatar” in a heading 1 format.
However, the HTML tag doesn’t give any information about what that text string means—“Avatar” could refer to the hugely successful 3D movie, or it could refer to a type of profile picture—and this can make it more difficult for search engines to intelligently display relevant content to a user.”
This means that search engines should have additional information to help them figure out what the webpage is about.
You can even link your entities directly to sites like Wikipedia or Google’s knowledge graph to build explicit connections. Using Schema this way can have positive SEO results, according to Martha van Berkel, CEO of Schema App:
“At Schema App, we’ve tested how entity linking can impact SEO. We found that disambiguating entities like places resulted in pages performing better on [near me] and other location-based search queries.
Our experiments also showed that entity linking can help pages show up for more relevant non-branded search queries, increasing click-through rates to the pages.
Here’s an example of entity linking. If your page talks about “Paris”, it can be confusing to search engines because there are several cities in the world named Paris.
If you are talking about the city of Paris in Ontario, Canada, you can use the sameAs property to link the Paris entity on your site to the known Paris, Ontario entity on Wikipedia, Wikidata, and Google’s Knowledge Graph.”
By helping search engines understand content, you are assisting them in saving resources (especially important when you have a large website with millions of pages) and increasing the chances for your content to be interpreted properly and ranked well. While this may not be a ranking factor directly, Schema helps your SEO efforts by giving search engines the best chance of interpreting your content correctly, giving users the best chance of discovering it.
What Is Schema Markup Used For?
Listed above are some of the most popular uses of schema, which are supported by Google and other search engines.
You may have an object type that has a schema.org definition but is not supported by search engines.
In such cases, it is advised to implement them, as search engines may start supporting them in the future, and you may benefit from them as you already have that implementation.
Types Of Schema Encoding: JSON-LD, Microdata, & RDFa
There are three primary formats for encoding schema markup:
JSON-LD.
Microdata.
RDFa.
Google recommends JSON-LD as the preferred format for structured data. Microdata is still supported, but JSON-LD schema is recommended.
In certain circumstances, it isn’t possible to implement JSON-LD schema due to website technical infrastructure limitations such as old content management systems). In these cases, the only option is to markup HTML via Microdata or RDFa.
You can now mix JSON-LD and Microdata formats by matching the @idattribute of JSON-LD schema with theitemidattribute of Microdata schema. This approach helps reduce the HTML size of your pages.
For example, in a FAQ section with extensive text, you can use Microdata for the content and JSON-LD for the structured data without duplicating the text, thus avoiding an increase in page size. We will dive deeper into this below in the article when discussing each type in detail.
1. JSON-LD Schema Format
JSON-LD encodes data using JSON, making it easy to integrate structured data into web pages. JSON-LD allows connecting different schema types using a graph with @ids, improving data integration and reducing redundancy.
Let’s look at an example. Let’s say that you own a store that sells high-quality routers. If you were to look at the source code of your homepage, you would likely see something like this:
Once you dive into the code, you’ll want to find the portion of your webpage that discusses what your business offers. In this example, that data can be found between the two
tags.
The following JSON-LD formatted text will markup the information within that HTML fragment on your webpage, which you may want to include in your webpage’s
section.
This snippet of code defines your business as a store via the attribute"@type": "Store".
Then, it details its location, contact information, hours of operation from Monday to Saturday, and different operational hours for Sunday.
By structuring your webpage data this way, you provide critical information directly to search engines, which can improve how they index and display your site in search results. Just like adding tags in the initial HTML, inserting this JSON-LD script tells search engines specific aspects of your business.
Let’s review another example of WebPage schema connected with Organization and Author schemas via @id. JSON-LD is the format Google recommends andother search engines because it’s extremely flexible, and this is a great example.
In the example:
Website links to the organization as the publisher with @id.
The organization is described with detailed properties.
WebPage links to the WebSite with isPartOf.
NewsArticle links to the WebPage with isPartOf, and back to the WebPage with mainEntityOfPage, and includes the author property via @id.
You can see how graph nodes are linked to each other using the"@id"attribute. This way, we inform Google that it is a webpage published by the publisher described in the schema.
The use of hashes (#) for IDs is optional. You should only ensure that different schema types don’t have the same ID by accident. Adding custom hashes (#) can be helpful, as it provides an extra layer of insurance that they will not be repeated.
You may wonder why we use"@id"to connect graph nodes. Can’t we just drop organization, author, and webpage schemas separately on the same page, and it is intuitive that those are connected?
The issue is that Google and other search engines cannot reliably interpret these connections unless explicitly linked using@id.
Adding to the graph additional schema types is as easy as constructing Lego bricks. Say we want to add an image to the schema:
As you already know from the NewsArticle schema, you need to add it to the above schema graph as a parent node and link via @id.
As you do that, it will have this structure:
Quite easy, isn’t it? Now that you understand the main principle, you can build your own schema based on the content you have on your website.
And since we live in the age of AI, you may also want to use ChatGPT or other chatbots to help you build any schema you want.
2. Microdata Schema Format
Microdata is a set of tags that aims to make annotating HTML elements with machine-readable tags much easier.
However, the one downside to using Microdata is that you have to mark every individual item within the body of your webpage. As you can imagine, this can quickly get messy.
Take a look at this sample HTML code, which corresponds to the above JSON schema with NewsArticle:
Our Company
Example Company, also known as Example Co., is a leading innovator in the tech industry.
Founded in 2000, we have grown to a team of 200 dedicated employees.
Our slogan is: "Innovation at its best".
Contact us at +1-800-555-1212 for customer service.
Our Founder
Our founder, Jane Smith, is a pioneer in the tech industry.
This example shows how complicated it becomes compared to JSON-LD since the markup is spread over HTML. Let’s understand what is in the markup.
You can see
tags like:
By adding this tag, we’re stating that the HTML code contained between the
blocks identifies a specific item.
Next, we have to identify what that item is by using the ‘itemtype’ attribute to identify the type of item (Person).
An item type comes in the form of a URL (such as https://schema.org/Person). Let’s say, for example, you have a product you may use http://schema.org/Product.
To make things easier, you can browse a list of item types here and view extensions to identify the specific entity you’re looking for. Keep in mind that this list is not all-encompassing but only includes ones that are supported by Google, so there is a possibility that you won’t find the item type for your specific niche.
It may look complicated, but Schema.org provides examples of how to use the different item types so you can see what the code is supposed to do.
Don’t worry; you won’t be left out in the cold trying to figure this out on your own!
To use this amazing tool, just select your item type, paste in the URL of the target page or the content you want to target, and then highlight the different elements so that you can tag them.
3. RDFa Schema Format
RDFa is an acronym for Resource Description Framework in Attributes. Essentially, RDFa is an extension to HTML5 designed to aid users in marking up structured data.
RDFa isn’t much different from Microdata. RDFa tags incorporate the preexisting HTML code in the body of your webpage. For familiarity, we’ll look at the same code above.
The HTML for the same JSON-LD news article will look like:
Unlike Microdata, which uses a URL to identify types, RDFa uses one or more words to classify types.
vocab=”http://schema.org/” typeof=”WebPage”>
If you wish to identify a property further, use the ‘typeof’ attribute.
Let’s compare JSON-LD, Microdata, and RDFa side by side. The @type attribute of JSON-LD is equivalent to the itemtype attribute of Microdata format and the typeof attribute in RDFa. Furthermore, the propertyName of JSON-LD attribute would be the equivalent of the itemprop and property attributes.
Attribute Name
JSON-LD
Microdata
RDFa
Type
@type
itemtype
typeof
ID
@id
itemid
resource
Property
propertyName
itemprop
property
Name
name
itemprop=”name”
property=”name”
Description
description
itemprop=”description”
property=”description”
For further explanation, you can visit Schema.org to check lists and view examples. You can find which kinds of elements are defined as properties and which are defined as types.
To help, every page on Schema.org provides examples of how to apply tags properly. Of course, you can also fall back on Google’s Structured Data Testing Tool.
4. Mixing Different Formats Of Structured Data With JSON-LD
If you use JSON-LD schema but certain parts of pages aren’t compatible with it, you can mix schema formats by linking them via @id.
For example, if you have live blogging on the website and a JSON-LD schema, including all live blogging items in the JSON schema would mean having the same content twice on the page, which may increase HTML size and affect First Contentful Paint and Largest Contentful Paint page speed metrics.
You can solve this either by generating JSON-LD dynamically with JavaScript when the page loads or by marking up HTML tags of live blogging via the Microdata format, then linking to your JSON-LD schema in the head section via “@id“.
Here is an example of how to do it.
Say we have this HTML with Microdata markup with itemid="https://www.example.com/live-blog-page/#live-blog"
Live Blog Headline
Explore the biggest announcements from DevDay
1:45 PM ETNov 6, 2023
OpenAI is taking the first step in gradual deployment of GPTs – tailored ChatGPT for a specific purpose – for safety purposes.
1:44 PM ETNov 6, 2023
ChatGPT now uses GPT-4 turbo with current knowledge.
It also knows which tool to choose for a task with GPT-4 All Tools.
1:43 PM ETNov 6, 2023
Microsoft CEO Satya Nadella joined Altman to announce deeper partnership with OpenAI to help developers bring more AI advancements.
We can link to it from the sample JSON-LD example we had like this:
If you copy and paste HTML and JSON examples underneath in the schema validator tool, you will see that they are validating properly.
The schema validator does validate the above example.
The SEO Impact Of Structured Data
This article explored the different schema encoding types and all the nuances regarding structured data implementation.
Schema is much easier to apply than it seems, and it’s a best practice you must incorporate into your webpages. While you won’t receive a direct boost in your SEO rankings for implementing Schema, it can:
Make your pages eligible to appear in rich results.
Ensure your pages get seen by the right users more often.
Avoid confusion and ambiguity.
The work may seem tedious. However, given time and effort, properly implementing Schema markup is good for your website and can lead to better user journeys through the accuracy of information you’re supplying to search engines.
Image Credits
Featured Image: Paulo Bobita Screenshot taken by author
Whether you are an SEO pro, marketer, or web developer, you might often need to change your browser’s user-agent to test different things.
For example, imagine you’re running a MAC-OS-specific campaign. To find out if your campaign is running properly and not targeting Linux users, changing the user-agent of your browser can help you test.
Changing user-agents is almost a daily task for web developers, as they need to test how websites behave in different browsers and devices.
What Is A User-Agent?
A user-agent is an HTTP request header string identifying browsers, applications, or operating systems that connect to the server.
Browsers have user-agents, and so do bots and crawlers such as search engines Googlebot, Google AdSense, etc.
Screenshot by author, May 2024
Here, we will learn how to change your browser’s user-agent.
The process is called user-agent spoofing.
Spoofing occurs when a browser or client sends a different user-agent HTTP header from what it is and fakes it.
While the term may be alarming, this is not a dangerous activity and will not cause you any problems. (Feel free to spoof your user-agent as much as you want.)
How To Change Your User-Agent On Chrome & Edge
Since Microsoft Edge is now using Chromium, the settings for both Chrome and Edge are the same.
1. Right Click Anywhere On Webpage > Inspect
Alternatively, you can use CTR+Shift+I on Windows and Cmd + Opt +J on Mac.
Screenshot by author, May 2024
2. Choose More Tools > Network Conditions
Screen new.
Click on the three vertical dots in the upper right corner.
Screenshot by author, May 2024
3. Uncheck Select Automatically Checkbox
Screenshot by author, May 2024
4. Choose One Among The Built-In User-Agents List
Screenshot by author, May 2024
If the user-agent you want doesn’t exist, you can enter any string you want on the field below the list.
For example, you can enter the following (Googlebot’s user-agent) into the custom field:
This may be useful for SEO professionals to identify if there is a cloaking on the website where the webpage shows specific content to Googlebot and different content to website visitors.
The user-agents are easy to spoof, and anyone can use these easy tricks to alter them.
This feature is useful for testing web apps against various devices, especially when the HTML is different for mobile or tablet devices.
It is a cost-efficient way to test websites as one doesn’t need to have many physical devices to be able to test.
However, certain issues may appear on the real device but not when testing by changing the user agent and using a browser emulator.
In that case, if you want to test on multiple real devices, I suggest using Browserstack, which offers testing opportunities on almost all devices.
FAQ
What is a user agent?
User agent is a HTTP request header string identifying browser, application, operating system which connects to the server. Not only browsers have user agent but also bots, search engines crawlers such as Googlebot, Google Adsense etc. which are not browsers.
What is user-agent spoofing?
When browser or any client sends different user-agent HTTP header from what they are and fakes it that is called spoofing.
How does changing the user-agent help SEO professionals?
SEO professionals may find changing the user-agent to be a critical part of their audit process. It is beneficial for several reasons:
Identifying cloaking issues: By mimicking different user-agents, such as Googlebot, SEO experts can uncover whether a website presents different content to search engines than users, which violates search engine guidelines.
Compatibility: It ensures web applications are compatible across various browsers and devices.
User Experience: Developers can optimize the user experience by understanding how content is rendered on different systems.
Debugging: Changing the user-agent can help pinpoint browser-specific issues.
Quality Assurance: It’s an essential step in quality assurance and helps maintain the integrity and performance of a website.
Can changing your browser’s user-agent pose a security risk?
No, changing your browser’s user-agent, commonly called user-agent spoofing, does not inherently pose a security risk. While the term “spoofing” might suggest malicious intent, this practice in the context of user-agents is harmless. It is a tool for developers and marketers to test how websites and applications interact with various devices and browsers.
This post was sponsored by JetOctopus. The opinions expressed in this article are the sponsor’s own.
If you manage a large website with over 10,000 pages, you can likely appreciate the unique SEO challenges that come with such scale.
Sure, the traditional tools and tactics — keyword optimization, link building, etc. — are important to establish a strong foundation and maintain basic SEO hygiene.
However, they may not fully address the technical complexities of Site Visibility for Searchbots and the dynamic needs of a large enterprise website.
This is where log analyzers become crucial. An SEO log analyzer monitors and analyzes server access logs to give you real insights into how search engines interact with your website. It allows you to take strategic action that satisfies both search crawlers and users, leading to stronger returns on your efforts.
In this post, you’ll learn what a log analyzer is and how it can enable your enterprise SEO strategy to achieve sustained success. But first, let’s take a quick look at what makes SEO tricky for big websites with thousands of pages.
The Unique SEO Challenges For Large Websites
Managing SEO for a website with over 10,000 pages isn’t just a step up in scale; it’s a whole different ball game.
Relying on traditional SEO tactics limits your site’s potential for organic growth. You can have the best titles and content on your pages, but if Googlebot can’t crawl them effectively, those pages will be ignored and may not get ranked ever.
Image created by JetOctopus, May 2024
For big websites, the sheer volume of content and pages makes it difficult to ensure every (important) page is optimized for visibility to Googlebot. Then, the added complexity of an elaborate site architecture often leads to significant crawl budget issues. This means Googlebot is missing crucial pages during its crawls.
Image created by JetOctopus, May 2024
Furthermore, big websites are more vulnerable to technical glitches — such as unexpected tweaks in the code from the dev team — that can impact SEO. This often exacerbates other issues like slow page speeds due to heavy content, broken links in bulk, or redundant pages that compete for the same keywords (keyword cannibalization).
All in all, these issues that come with size necessitate a more robust approach to SEO. One that can adapt to the dynamic nature of big websites and ensure that every optimization effort is more meaningful toward the ultimate goal of improving visibility and driving traffic.
This strategic shift is where the power of an SEO log analyzer becomes evident, providing granular insights that help prioritize high-impact actions. The primary action being to better understand Googlebot like it’s your website’s main user — until your important pages are accessed by Googlebot, they won’t rank and drive traffic.
What Is An SEO Log Analyzer?
An SEO log analyzer is essentially a tool that processes and analyzes the data generated by web servers every time a page is requested. It tracks how search engine crawlers interact with a website, providing crucial insights into what happens behind the scenes. A log analyzer can identify which pages are crawled, how often, and whether any crawl issues occur, such as Googlebot being unable to access important pages.
By analyzing these server logs, log analyzers help SEO teams understand how a website is actually seen by search engines. This enables them to make precise adjustments to enhance site performance, boost crawl efficiency, and ultimately improve SERP visibility.
Put simply, a deep dive into the logs data helps discover opportunities and pinpoint issues that might otherwise go unnoticed in large websites.
But why exactly should you focus your efforts on treating Googlebot as your most important visitor?
Why is crawl budget a big deal?
Let’s look into this.
Optimizing Crawl Budget For Maximum SEO Impact
Crawl budget refers to the number of pages a search engine bot — like Googlebot — will crawl on your site within a given timeframe. Once a site’s budget is used up, the bot will stop crawling and move on to other websites.
Crawl budgets vary for every website and your site’s budget is determined by Google itself, by considering a range of factors such as the site’s size, performance, frequency of updates, and links. When you focus on optimizing these factors strategically, you can increase your crawl budget and speed up ranking for new website pages and content.
As you’d expect, making the most of this budget ensures that your most important pages are frequently visited and indexed by Googlebot. This typically translates into better rankings (provided your content and user experience are solid).
And here’s where a log analyzer tool makes itself particularly useful by providing detailed insights into how crawlers interact with your site. As mentioned earlier, it allows you to see which pages are being crawled and how often, helping identify and resolve inefficiencies such as low-value or irrelevant pages that are wasting valuable crawl resources.
An advanced log analyzer like JetOctopus offers a complete view of all the stages from crawling and indexation to getting organic clicks. Its SEO Funnel covers all the main stages, from your website being visited by Googlebot to being ranked in the top 10 and bringing in organic traffic.
Image created by JetOctopus, May 2024
As you can see above, the tabular view shows how many pages are open to indexation versus those closed from indexation. Understanding this ratio is crucial because if commercially important pages are closed from indexation, they will not appear in subsequent funnel stages.
The next stage examines the number of pages crawled by Googlebot, with “green pages” representing those crawled and within the structure, and “gray pages” indicating potential crawl budget waste because they are visited by Googlebot but not within the structure, possibly orphan pages or accidentally excluded from the structure. Hence, it’s vital to analyze this part of your crawl budget for optimization.
The later stages include analyzing what percentage of pages are ranked in Google SERPs, how many of these rankings are in the top 10 or top three, and, finally, the number of pages receiving organic clicks.
Overall, the SEO funnel gives you concrete numbers, with links to lists of URLs for further analysis, such as indexable vs. non-indexable pages and how crawl budget waste is occurring. It is an excellent starting point for crawl budget analysis, allowing a way to visualize the big picture and get insights for an impactful optimization plan that drives tangible SEO growth.
Put simply, by prioritizing high-value pages — ensuring they are free from errors and easily accessible to search bots — you can greatly improve your site’s visibility and ranking.
Using an SEO log analyzer, you can understand exactly what should be optimized on pages that are being ignored by crawlers, work on them, and thus attract Googlebot visits. A log analyzer benefits in optimizing other crucial aspects of your website:
Image created by JetOctopus, May 2024
Detailed Analysis of Bot Behavior: Log analyzers allow you to dissect how search bots interact with your site by examining factors like the depth of their crawl, the number of internal links on a page, and the word count per page. This detailed analysis provides you with the exact to-do items for optimizing your site’s SEO performance.
Improves Internal Linking and Technical Performance: Log analyzers provide detailed insights into the structure and health of your site. They help identify underperforming pages and optimize the internal links placement, ensuring a smoother user and crawler navigation. They also facilitate the fine-tuning of content to better meet SEO standards, while highlighting technical issues that may affect site speed and accessibility.
Aids in Troubleshooting JavaScript and Indexation Challenges: Big websites, especially eCommerce, often rely heavily on JavaScript for dynamic content. In the case of JS websites, the crawling process is lengthy. A log analyzer can track how well search engine bots are able to render and index JavaScript-dependent content, underlining potential pitfalls in real-time. It also identifies pages that are not being indexed as intended, allowing for timely corrections to ensure all relevant content can rank.
Helps Optimize Distance from Index (DFI): The concept of Distance from Index (DFI) refers to the number of clicks required to reach any given page from the home page. A lower DFI is generally better for SEO as it means important content is easier to find, both by users and search engine crawlers. Log analyzers help map out the navigational structure of your site, suggesting changes that can reduce DFI and improve the overall accessibility of key content and product pages.
Besides, historical log data offered by a log analyzer can be invaluable. It helps make your SEO performance not only understandable but also predictable. Analyzing past interactions allows you to spot trends, anticipate future hiccups, and plan more effective SEO strategies.
With JetOctopus, you benefit from no volume limits on logs, enabling comprehensive analysis without the fear of missing out on crucial data. This approach is fundamental in continually refining your strategy and securing your site’s top spot in the fast-evolving landscape of search.
Real-World Wins Using Log Analyzer
Big websites in various industries have leveraged log analyzers to attain and maintain top spots on Google for profitable keywords, which has significantly contributed to their business growth.
For example, Skroutz, Greece’s biggest marketplace website with over 1 million sessions daily, set up a real-time crawl and log analyzer tool that helped them know things like:
Does Googlebot crawl pages that have more than two filters activated?
How extensively does Googlebot crawl a particularly popular category?
What are the main URL parameters that Googlebot crawls?
Does Googlebot visit pages with filters like “Size,” which are typically marked as nofollow?
This ability to see real-time visualization tables and historical log data spanning over ten months for monitoring Googlebot crawls effectively enabled Skroutz to find crawling loopholes and decrease index size, thus optimizing its crawl budget.
Eventually, they also saw a reduced time for new URLs to be indexed and ranked — instead of taking 2-3 months to index and rank new URLs, the indexing and ranking phase took only a few days.
This strategic approach to technical SEO using log files has helped Skroutz cement its position as one of the top 1000 websites globally according to SimilarWeb, and the fourth most visited website in Greece (after Google, Facebook, and Youtube) with over 70% share of its traffic from organic search.
Image created by JetOctopus, May 2024
Another case in point is DOM.RIA, Ukraine’s popular real estate and rental listing website, which doubled the Googlebot visits by optimizing their website’s crawl efficiency. As their site structure is huge and elaborate, they needed to optimize the crawl efficiency for Googlebot to ensure the freshness and relevance of content appearing in Google.
Initially, they implemented a new sitemap to improve the indexing of deeper directories. Despite these efforts, Googlebot visits remained low.
By using the JetOctopus to analyze their log files, DOM.RIA identified and addressed issues with their internal linking and DFI. They then created mini-sitemaps for poorly scanned directories (such as for the city, including URLs for streets, districts, metro, etc.) while assigning meta tags with links to pages that Googlebot often visits. This strategic change resulted in a more than twofold increase in Googlebot activity on these crucial pages within two weeks.
Image created by JetOctopus, May 2024
Getting Started With An SEO Log Analyzer
Now that you know what a log analyzer is and what it can do for big websites, let’s take a quick look at the steps involved in logs analysis.
Here is an overview of using an SEO log analyzer like JetOctopus for your website:
Integrate Your Logs: Begin by integrating your server logs with a log analysis tool. This step is crucial for capturing all data related to site visits, which includes every request made to the server.
Identify Key Issues: Use the log analyzer to uncover significant issues such as server errors (5xx), slow load times, and other anomalies that could be affecting user experience and site performance. This step involves filtering and sorting through large volumes of data to focus on high-impact problems.
Fix the Issues: Once problems are identified, prioritize and address these issues to improve site reliability and performance. This might involve fixing broken links, optimizing slow-loading pages, and correcting server errors.
Combine with Crawl Analysis: Merge log analysis data with crawl data. This integration allows for a deeper dive into crawl budget analysis and optimization. Analyze how search engines crawl your site and adjust your SEO strategy to ensure that your most valuable pages receive adequate attention from search bots.
And that’s how you can ensure that search engines are efficiently indexing your most important content.
Conclusion
As you can see, the strategic use of log analyzers is more than just a technical necessity for large-scale websites. Optimizing your site’s crawl efficiency with a log analyzer can immensely impact your SERP visibility.
For CMOs managing large-scale websites, embracing a log analyzer and crawler toolkit like JetOctopus is like getting an extra tech SEO analyst that bridges the gap between SEO data integration and organic traffic growth.
This post was sponsored by DebugBear. The opinions expressed in this article are the sponsor’s own.
Keeping your website fast is important for user experience and SEO.
The Core Web Vitals initiative by Google provides a set of metrics to help you understand the performance of your website.
The three Core Web Vitals metrics are:
This post focuses on the recently introduced INP metric and what you can do to improve it.
How Is Interaction To Next Paint Measured?
INP measures how quickly your website responds to user interactions – for example, a click on a button. More specifically, INP measures the time in milliseconds between the user input and when the browser has finished processing the interaction and is ready to display any visual updates on the page.
Your website needs to complete this process in under 200 milliseconds to get a “Good” score. Values over half a second are considered “Poor”. A poor score in a Core Web Vitals metric can negatively impact your search engine rankings.
Google collects INP data from real visitors on your website as part of the Chrome User Experience Report (CrUX). This CrUX data is what ultimately impacts rankings.
Image created by DebugBear, May 2024
How To Identify & Fix Slow INP Times
The factors causing poor Interaction to Next Paint can often be complex and hard to figure out. Follow this step-by-step guide to understand slow interactions on your website and find potential optimizations.
1. How To Identify A Page With Slow INP Times
Different pages on your website will have different Core Web Vitals scores. So you need to identify a slow page and then investigate what’s causing it to be slow.
By default, page URLs are grouped into URL groups that cover many different pages. Be careful here – not all pages might have the problem that Google is reporting. Instead, click on each URL group to see if URL-specific data is available for some pages and then focus on those.
Screenshot of Google Search Console, May 2024
Using A Real-User Monitoring (RUM) Service
Google won’t report Core Web Vitals data for every page on your website, and it only provides the raw measurements without any details to help you understand and fix the issues. To get that you can use a real-user monitoring tool like DebugBear.
Real-user monitoring works by installing an analytics snippet on your website that measures how fast your website is for your visitors. Once that’s set up you’ll have access to an Interaction to Next Paint dashboard like this:
Screenshot of the DebugBear Interaction to Next Paint dashboard, May 2024
You can identify pages you want to optimize in the list, hover over the URL, and click the funnel icon to look at data for that specific page only.
Image created by DebugBear, May 2024
2. Figure Out What Element Interactions Are Slow
Different visitors on the same page will have different experiences. A lot of that depends on how they interact with the page: if they click on a background image there’s no risk of the page suddenly freezing, but if they click on a button that starts some heavy processing then that’s more likely. And users in that second scenario will experience much higher INP.
To help with that, RUM data provides a breakdown of what page elements users interacted with and how big the interaction delays were.
Screenshot of the DebugBear INP Elements view, May 2024
The screenshot above shows different INP interactions sorted by how frequent these user interactions are. To make optimizations as easy as possible you’ll want to focus on a slow interaction that affects many users.
In DebugBear, you can click on the page element to add it to your filters and continue your investigation.
3. Identify What INP Component Contributes The Most To Slow Interactions
Input Delay: Background code that blocks the interaction from being processed.
Processing Time: The time spent directly handling the interaction.
Presentation Delay: Displaying the visual updates to the screen.
You should focus on which INP component is the biggest contributor to the slow INP time, and ensure you keep that in mind during your investigation.
Screenshot of the DebugBear INP Components, May 2024
In this scenario, Processing Time is the biggest contributor to the slow INP time for the set of pages you’re looking at, but you need to dig deeper to understand why.
High processing time indicates that there is code intercepting the user interaction and running slow performing code. If instead you saw a high input delay, that suggests that there are background tasks blocking the interaction from being processed, for example due to third-party scripts.
4. Check Which Scripts Are Contributing To Slow INP
Sometimes browsers report specific scripts that are contributing to a slow interaction. Your website likely contains both first-party and third-party scripts, both of which can contribute to slow INP times.
A RUM tool like DebugBear can collect and surface this data. The main thing you want to look at is whether you mostly see your own website code or code from third parties.
Screenshot of the INP Primary Script Domain Grouping in DebugBear, May 2024
Tip: When you see a script, or source code function marked as “N/A”, this can indicate that the script comes from a different origin and has additional security restrictions that prevent RUM tools from capturing more detailed information.
This now begins to tell a story: it appears that analytics/third-party scripts are the biggest contributors to the slow INP times.
5. Identify Why Those Scripts Are Running
At this point, you now have a strong suspicion that most of the INP delay, at least on the pages and elements you’re looking at, is due to third-party scripts. But how can you tell whether those are general tracking scripts or if they actually have a role in handling the interaction?
DebugBear offers a breakdown that helps see why the code is running, called the INP Primary Script Invoker breakdown. That’s a bit of a mouthful – multiple different scripts can be involved in slowing down an interaction, and here you just see the biggest contributor. The “Invoker” is just a value that the browser reports about what caused this code to run.
Screenshot of the INP Primary Script Invoker Grouping in DebugBear, May 2024
The following invoker names are examples of page-wide event handlers:
onclick
onmousedown
onpointerup
You can see those a lot in the screenshot above, which tells you that the analytics script is tracking clicks anywhere on the page.
In contrast, if you saw invoker names like these that would indicate event handlers for a specific element on the page:
.load_more.onclick
#logo.onclick
6. Review Specific Page Views
A lot of the data you’ve seen so far is aggregated. It’s now time to look at the individual INP events, to form a definitive conclusion about what’s causing slow INP in this example.
Real user monitoring tools like DebugBear generally offer a way to review specific user experiences. For example, you can see what browser they used, how big their screen is, and what element led to the slowest interaction.
Screenshot of a Page View in DebugBear Real User Monitoring, May 2024
As mentioned before, multiple scripts can contribute to overall slow INP. The INP Scripts section shows you the scripts that were run during the INP interaction:
Screenshot of the DebugBear INP script breakdown, May 2024
You can review each of these scripts in more detail to understand why they run and what’s causing them to take longer to finish.
7. Use The DevTools Profiler For More Information
Real user monitoring tools have access to a lot of data, but for performance and security reasons they can access nowhere near all the available data. That’s why it’s a good idea to also use Chrome DevTools to measure your page performance.
To debug INP in DevTools you can measure how the browser processes one of the slow interactions you’ve identified before. DevTools then shows you exactly how the browser is spending its time handling the interaction.
Screenshot of a performance profile in Chrome DevTools, May 2024
How You Might Resolve This Issue
In this example, you or your development team could resolve this issue by:
Working with the third-party script provider to optimize their script.
Removing the script if it is not essential to the website, or finding an alternative provider.
Adjusting how your own code interacts with the script
How To Investigate High Input Delay
In the previous example most of the INP time was spent running code in response to the interaction. But often the browser is already busy running other code when a user interaction happens. When investigating the INP components you’ll then see a high input delay value.
This can happen for various reasons, for example:
The user interacted with the website while it was still loading.
A scheduled task is running on the page, for example an ongoing animation.
The page is loading and rendering new content.
To understand what’s happening, you can review the invoker name and the INP scripts section of individual user experiences.
Screenshot of the INP Component breakdown within DebugBear, May 2024
In this screenshot, you can see that a timer is running code that coincides with the start of a user interaction.
The script can be opened to reveal the exact code that is run:
Screenshot of INP script details in DebugBear, May 2024
The source code shown in the previous screenshot comes from a third-party user tracking script that is running on the page.
At this stage, you and your development team can continue with the INP workflow presented earlier in this article. For example, debugging with browser DevTools or contacting the third-party provider for support.
How To Investigate High Presentation Delay
Presentation delay tends to be more difficult to debug than input delay or processing time. Often it’s caused by browser behavior rather than a specific script. But as before, you still start by identifying a specific page and a specific interaction.
You can see an example interaction with high presentation delay here:
Screenshot of the an interaction with high presentation delay, May 2024
You see that this happens when the user enters text into a form field. In this example, many visitors pasted large amounts of text that the browser had to process.
Here the fix was to delay the processing, show a “Waiting…” message to the user, and then complete the processing later on. You can see how the INP score improves from May 3:
Screenshot of an Interaction to Next Paint timeline in DebugBear, May 2024
Get The Data You Need To Improve Interaction To Next Paint
Screenshot of the DebugBear Core Web Vitals dashboard, May 2024
Google’s CrUX data is aggregated over a 28-day period, which means that it’ll take a while before you notice a regression. With real-user monitoring you can see the impact of website changes right away and get alerted automatically when there’s a big change.

DebugBear monitors lab data, CrUX data, and real user data. That way you have all the data you need to optimize your Core Web Vitals in one place.
This article has been sponsored by DebugBear, and the views presented herein represent the sponsor’s perspective.
Ready to start optimizing your website? Sign up for DebugBear and get the data you need to deliver great user experiences.
Thankfully, there are plenty of steps you can take to protect your WordPress website.
Easy WordPress Security Basics
When setting up your WordPress site security, there are some basic things you can do to beef up your protection.

Below, we will take a look at some of the first things you should do to help protect your website.
1. Implement SSL Certificates
Secure Sockets Layer (SSL) certificates are a standard technology that establishes an encrypted connection between a web server (host) and a web browser (client). This connection ensures all data passed between the two remains private and intrinsic.
SSL certificates are an industry-standard used by millions of websites to protect their online transactions with their customers, and obtaining one should be one of the first steps you take to secure your website.
2. Require & Use Strong Passwords
Along with obtaining an SSL certificate, one of the very first things you can do to protect your site is use strong passwords for all your logins.
It might be tempting to create or reuse a familiar or easy-to-remember password, but doing so puts both you and your website at risk. Improving your password strength and security decreases your chances of being hacked. The stronger your password, the less likely you are to be a victim of a cyberattack.
If you aren’t sure if you are using a strong enough password, you check the strength of one by using a free tool like this helpful Password Strength Checker.
3. Install A Security Plugin
WordPress plugins are a great way to quickly add useful features to your website, and there are several great security plugins available.
Installing a security plugin can add some extra layers of protection to your website without requiring much effort.
To get you started, check out this list of recommended WordPress security plugins.
4. Keep WordPress Core Files Updated
As of 2024, there are an estimated 1.09 billion total websites on the web with more than 810 million of those sites using WordPress.
Because of its popularity, WordPress websites are oftentimes a target for hackers, malware attacks, and data thieves.
Keeping your WordPress installation up to date at all times is critical to maintain the security and stability of your site.
Every time a WordPress security vulnerability is reported, the core team starts working to release an update that fixes the issue.
If you aren’t updating your WordPress website, then you are likely using a version of WordPress that has known vulnerabilities.
There is especially no excuse for using an outdated version of WordPress since the introduction of automatic updates.
Don’t leave yourself open to attack by using an old version of WordPress. Turn on auto updates and forget about it.
If you would like an even easier way to handle updates, consider a Managed WordPress solution that has auto updates built in.
5. Pay Attention To Themes & Plugins
Keeping WordPress updated ensures your core files are in check, but there are other areas where WordPress is vulnerable that core updates might not protect such as your themes and plugins.
For starters, only ever install plugins and themes from trusted developers. If a plugin or theme wasn’t developed by a credible source, you are probably safer not using it.
On top of that, make sure to update WordPress plugins and themes. Just like an outdated version of WordPress, using outdated plugins and themes makes your website more vulnerable to attack.
6. Run Frequent Website Backups
One way to protect your WordPress website is to always have a current backup of your site and important files.
The last thing you want is for something to happen to your site and you do not have a backup.
Backup your site, and do so often. That way if something does happen to your website, you can quickly restore a previous version of it and quickly get back up and running.
Intermediate WordPress Security Measures That Add More Protection
If you’ve completed all the basics but you still want to do more to protect your website, there are some more advanced steps you can take to bolster your security.
Let’s take a look at what you should do next.
7. Never Use The “Admin” Username
Never use the “admin” username. Doing so makes you susceptible to brute force attacks and social engineering scams.
Because “admin” is such a common username, it is easily-guessed and makes things much easier for scammers to trick people into giving away their login credentials.
Much like having a strong password, using a unique username for your logins is a good idea because it makes it much harder for hackers to crack your login info.
On top of using a unique username another thing you can do to protect your login credentials is hide your WordPress admin login page with a plugin like WPS Hide Login.
By default, a majority of WordPress login pages can be accessed by adding “/wp-admin” or “/wp-login.php” to the end of a URL. Once a hacker or scammer has identified your login page, they can then attempt to guess your username and password in order to access your Admin Dashboard.
Hiding your WordPress login page is a good way to make you a less easy target.
9. Disable XML-RPC
WordPress uses an implementation of the XML-RPC protocol to extend functionality to software clients.
Most users don’t need WordPress XML-RPC functionality, and it’s one of the most common vulnerabilities that opens users up for exploits.
That’s why it’s a good idea to disable it. Thanks to the Wordfence Security plugin, it is really easy to do just that.
10. Harden wp-config.php File
The process of adding extra security features to your WordPress site is sometimes known as “hardening” because you are essentially giving your site some extra armor against hackers.
You can “harden” your website by protecting your wp-config.php file via your .htaccess file. Your WordPress wp-config.php file contains very sensitive information about your WordPress installation including your WordPress security keys and the WordPress database connection details, which is exactly why you don’t want it to be easy to access.
11. Run A Security Scanning Tool
Sometimes your WordPress website might have a vulnerability that you had no idea existed. That’s why it’s wise to use some tools that can find vulnerabilities and even fix them for you.
The WPScan plugin scans for known vulnerabilities in WordPress core files, plugins and themes. The plugin also notifies you by email when new security vulnerabilities are found.
Strengthen Your Server-Side Security
So you have taken all the above measures to protect your website but you still want to know if there is more you can do to make it as secure as possible.
The remaining actions you can take to beef up your security will need to be done on the server side of your website.
12. Look For A Hosting Company That Does This
One of the best things you can do to protect your site from the very get-go is to choose the right hosting company to host your WordPress website.
When looking for a hosting company, you want to find one that is fast, reliable, and secure, and will support you with great customer service.
That means they should have good, powerful resources, maintain an uptime of at least 99.5%, and use server-level security tactics.
If a host can’t check those basic boxes, they are not worth your time or money.
13. Use The Latest PHP Version
Like old versions of WordPress, outdated versions of PHP are no longer safe to use.
If you aren’t on the latest version of PHP, upgrade your PHP version to protect yourself from attack.
14. Host On A Fully-Isolated Server
Fully-isolated virtual private servers have a lot of advantages and one of those advantages is increased security.
The physical isolation offered from a cloud-based VPS is inherently secure, protecting your website against cross-infection from other customers. Combined with robust firewalls and DDoS protection, your data remains secure against potential threats and vulnerabilities.
Looking for the perfect cloud environment for your WordPress website? Look no further.
With InMotion Hosting’s Platform i, you receive unparalleled security features including managed server updates, real-time security patching, web application firewalls, and DDoS prevention, along with purpose-built high-availability servers optimized for fast and reliable WordPress sites.
15. Use A Web Application Firewall
One of the final things you can do to add extra security measures to your WordPress website is use a web application firewall (WAF).
A WAF is usually a cloud-based security system that offers another layer of protection around your site. Think of it as a gateway for your site. It blocks all hacking attempts and filters out other malicious types of traffic like distributed denial-of-service (DDoS) attacks or spammers.
WAFs usually require monthly subscription fees, but adding one is worth the cost if you place a premium on your WordPress website security.
Make Sure Your Website & Business Is Safe & Secure
If your website is not secure, you could be leaving yourself open to a cyber attack.
Thankfully, securing a WordPress site doesn’t require too much technical knowledge as long as you have the right tools and hosting plan to fit your needs.
Instead of waiting to respond to threats once they happen, you should proactively secure your website to prevent security issues.
That way if someone does target your website, you are prepared to mitigate the risk and go about your business as usual instead of scrambling to locate a recent backup.
Get Managed WordPress Hosting featuring robust security measures on high-performance servers, complete with free SSL, dedicated IP address, automatic server updates, DDoS protection, and included WAF.
Learn more about how Managed WordPress Hosting can help protect your website and valuable data from exposure to hackers and scammers.
Google has again delayed its plan to phase out third-party cookies in the Chrome web browser. The latest postponement comes after ongoing challenges in reconciling feedback from industry stakeholders and regulators.
The announcement was made in Google and the UK’s Competition and Markets Authority (CMA) joint quarterly report on the Privacy Sandbox initiative, scheduled for release on April 26.
Chrome’s Third-Party Cookie Phaseout Pushed To 2025
Google states it “will not complete third-party cookie deprecation during the second half of Q4” this year as planned.
Instead, the tech giant aims to begin deprecating third-party cookies in Chrome “starting early next year,” assuming an agreement can be reached with the CMA and the UK’s Information Commissioner’s Office (ICO).
The statement reads:
“We recognize that there are ongoing challenges related to reconciling divergent feedback from the industry, regulators and developers, and will continue to engage closely with the entire ecosystem. It’s also critical that the CMA has sufficient time to review all evidence, including results from industry tests, which the CMA has asked market participants to provide by the end of June.”
Continued Engagement With Regulators
Google reiterated its commitment to “engaging closely with the CMA and ICO” throughout the process and hopes to conclude discussions this year.
This marks the third delay to Google’s plan to deprecate third-party cookies, initially aiming for a Q3 2023 phaseout before pushing it back to late 2024.
The postponements reflect the challenges in transitioning away from cross-site user tracking while balancing privacy and advertiser interests.
Transition Period & Impact
In January, Chrome began restricting third-party cookie access for 1% of users globally. This percentage was expected to gradually increase until 100% of users were covered by Q3 2024.
However, the latest delay gives websites and services more time to migrate away from third-party cookie dependencies through Google’s limited “deprecation trials” program.
The trials offer temporary cookie access extensions until December 27, 2024, for non-advertising use cases that can demonstrate direct user impact and functional breakage.
While easing the transition, the trials have strict eligibility rules. Advertising-related services are ineligible, and origins matching known ad-related domains are rejected.
Google states the program aims to address functional issues rather than relieve general data collection inconveniences.
Publisher & Advertiser Implications
The repeated delays highlight the potential disruption for digital publishers and advertisers relying on third-party cookie tracking.
Industry groups have raised concerns that restricting cross-site tracking could push websites toward more opaque privacy-invasive practices.
However, privacy advocates view the phaseout as crucial in preventing covert user profiling across the web.
With the latest postponement, all parties have more time to prepare for the eventual loss of third-party cookies and adopt Google’s proposed Privacy Sandbox APIs as replacements.
Mozilla has implemented a performance upgrade to its Firefox web browser that could translate into faster website load times – welcome news for SEO professionals and their clients.
The technical details involve moving certain tasks, specifically decompression of gzip and brotli content, away from the browser’s main processing thread.
While this might sound complex, the result is quite simple: web pages load more quickly and feel more responsive when using Firefox.
Networking decompression (gzip, brotli) have been moved off-main-thread as part of ongoing efforts to reduce main thread contention. This work has delivered huge performance wins on our high level page load metrics, reducing FCP and LCP by 10%. See https://t.co/1vVMg6LINc
“This work has delivered huge performance wins on our high-level page load metrics, reducing First Contentful Paint and Largest Contentful Paint by 10%.”
First Contentful Paint and Largest Contentful Paint measure how quickly websites render content visible to users after navigation.
Improving these by 10% could mean millions of web pages loading noticeably faster in Firefox.
Why SEJ Cares
For SEO professionals, websites that load quickly are crucial for providing a good user experience, potentially influencing search rankings.
Any measures that speed up load times are good for SEO.
The performance upgrade has also drawn praise from web experts.
Barry Pollard, a respected voice on web performance, tweeted that Firefox’s threading change “should be some good responsiveness wins” that could enhance browser interactivity.
Nice. Should be some good responsiveness wins by this too for Firefox users. INP isn’t measurable in Firefox at the moment but would have shown this if it was. https://t.co/46nAFL6MQW
In the constantly accelerating online world, shaving precious milliseconds off load times keeps websites competitive and users engaged.
As Firefox rolls out this updated version, expect faster load times and smoother user experiences in this browser.
FAQ
What are First Contentful Paint and Largest Contentful Paint, and why are they important?
First Contentful Paint (FCP) and Largest Contentful Paint (LCP) are performance metrics used to assess the speed at which a website presents visual content to its users after navigation.
FCP measures the time from navigation to when the browser renders the first piece of content from the DOM, providing a user with the first visual indication that a page is loading.
LCP, on the other hand, marks the point in the page load timeline when the largest text block or image element is rendered on the screen.
These metrics are relevant to SEO as they indicate user experience quality; faster FCP and LCP times generally correlate with a better user experience, which can positively impact search visibility.
Ensuring your website reaches as broad an audience as possible isn’t just about amplifying your search visibility – it’s also about making sure your site can be used by everyone, irrespective of their disabilities.
In this post, we’ll explore the relationship between web accessibility and SEO performance and explain some best practices for ensuring your site can accommodate all users.
What Is Web Accessibility?
Web accessibility refers to the practice of making websites and online applications usable for everyone, including people with disabilities.
The goal is to provide a seamless online user experience for people with impairments that would typically affect access to the web, such as auditory, visual, cognitive, physical, and neurological conditions.
These internationally recognized guidelines provide a framework for making web content more accessible, with the aim of creating a more inclusive internet experience for all users.
The WCAG outlines four core principles essential for web accessibility (often summarized by the acronym POUR).
These principles ensure that websites are:
Perceivable: Content and user interface components should be presented in a way any user can perceive.
Operable: All users should be able to interact with interface components and navigational elements.
Understandable: Users must be able to understand the information on the page
Robust: A variety of users and assistive technologies (like screen readers and text-to-speech software) should be able to interpret the content on the page.
How Does Web Accessibility Impact SEO?
Web accessibility and SEO may seem like distinct aspects of website management.
After all, one focuses on making online content usable for people with disabilities, while the other focuses on boosting a website’s search engine rankings.
However, these two areas have a significant overlap.
Improvements in web accessibility can have a positive impact on SEO in several ways, including:
Providing a better user experience: Google considers user experience when deciding where to rank web pages in its search results. And since web accessibility aims to improve the web user experience for everyone, implementing accessibility best practices can indirectly contribute to better search visibility.
Enhancing content readability and structure: Good website accessibility calls for the clear, logical, and organized presentation of content – all of which correspond to SEO best practices. Structured headings (H1, H2, H3 tags), descriptive link text, and easy-to-read fonts help both human users and search engine bots navigate and understand your site better.
Improving image visibility: Using alt attributes to describe images not only makes your site more accessible to visually impaired users but also allows search engines to better understand and index your multimedia content. This, in turn, can enhance your visibility for image searches, drawing more traffic to your site.
5 SEO Tips To Make Your Website More Accessible
Now that you understand the link between web accessibility and SEO, let’s look at some best practices to boost your site’s usability.