10 Top Converting Landing Pages That Boost Your ROI [With Examples] via @sejournal, @unbounce

This post was sponsored by Unbounce. The opinions expressed in this article are the sponsor’s own.

Want to increase sign-ups, sales, or demo requests from your landing page?

How can you ensure your landing page is optimized for conversions?

Landing pages can make or break your conversions.

A well-designed landing page doesn’t just look good; it also seamlessly guides visitors toward action, such as signing up, purchasing, or booking a demo.

A high-performing landing page should align with your goals:

  • Capturing leads.
  • Driving sales.
  • Promoting an event.

The best landing page templates are designed with conversion in mind, featuring strategic layouts, persuasive copy, and clear calls to action.

So, let’s look at a few top-performing landing page examples to learn about why they work and how you should implement them.

1 & 2. FreshGoods & Radiant Yoga Studio: Great For A Clear & Compelling Unique Selling Point

The secret to beating the competition is positioning your brand so you’re the only one in your specific space.

How? By honing in on your Unique Value Proposition (UVP):

  • What is the one reason to choose you, your products, or services?
  • Where does your competition fall short?
  • How do you make your UVP stand out?

FreshGoods Landing Page

Landing pageImage by Unbounce, 2025

Radiant Yoga Landing Page

yoga landing pageImage by Unbounce, 2025

Why They Work

These conversion-optimized landing page templates effectively highlight a USP throughout the design.

  • A clear and bold headline that immediately communicates the core benefit.
  • The supporting subheadline allows brands to reinforce the core USP message by expanding on the offer in a way that adds clarity without overwhelming visitors.
  • The strategic use of whitespace and strong typography ensures that the USP remains the focal point, making it easy for visitors to grasp the value of the offer at a glance.

How To Recreate These Landing Pages

Step 1: Define Your Unique Selling Proposition

A strong USP makes visitors feel like they’ve found exactly what they need. Instead of blending in with competitors, it positions your brand as the only choice.

  • Ask yourself: What is the one reason customers should choose you over others?
  • Example: FreshGoods & Radiant Yoga Studio’s landing pages showcase a crystal-clear UVP in their messaging and design.

Step 2: Craft a Compelling Headline & Supporting Headline

Your headline is your first impression, so you have to make it count. The supporting headline expands on that core message.

  • Best Practices:
    • Be specific: Instead of “The Best Marketing Tool,” try “Turn Clicks into Customers with AI-Powered Marketing in Minutes.”
    • Reinforce value: “No coding, no guesswork. Just smarter campaigns that drive real revenue.”

Step 3: Address Concerns with Reinforcing & Closing Statements

  • A reinforcing statement builds trust (“Trusted by over 10,000 businesses…”).
  • A closing statement eliminates hesitation (“Every second you wait is a sale you’re losing. Start your free trial now.”)

3 & 4. Vita Health & Orbit SaaS: Great For Hero Images & Visual Storytelling

Before visitors read a single word, visuals will capture their attention and convey meaning.

A strong hero image isn’t just decoration,  it sets the tone, builds trust, and instantly reinforces your message. The right imagery makes your offer feel more tangible, relatable, and desirable.

Vita Health Landing Page

health wearables landing page exampleImage by Unbounce, 2025

Orbit Flow Landing Page

SaaS landing page example and inspirationImage by Unbounce, 2025

Why They Work

A landing page’s imagery is a strategic tool that helps communicate your offer, build trust, and nudge visitors toward conversion. Choose visuals that don’t just look good but work hard to sell.

A well-chosen visual:

  • Supports the UVP.
  • Evokes an emotion that drives action
  • Showcases the product, service, or outcome in action
  • Makes the page feel polished, professional, and credible

In addition to the visual, the full landing page benefits from:

  • Strong hero image placement
  • An opportunity to reinforce the messaging conveyed with the hero image throughout the page
  • White space highlights supporting visuals
  • Visual hierarchy guides site visitors down the page to the parts that matter.

How To Recreate These Landing Pages

Step 1: Choose the Right Hero Image

Before visitors read a word, visuals capture attention. A great hero image should:

  • Support the USP
  • Evoke emotion & drive action
  • Showcase the product, service, or outcome

Step 2: Guide the Visitor’s Eye

Strategic use of visuals can nudge visitors toward your CTA:

  • Eye gaze: People follow where others are looking in an image.
  • Angles & positioning: Lines or arrows subtly direct attention to the CTA.
  • Contrast & color: Key elements should stand out.

Step 3: Reinforce Messaging with Supporting Imagery

Don’t rely on just one image. Use:

  • Icons & illustrations
  • Graphs & charts
  • Customer photos & testimonials
  • Short videos or GIFs

Bonus Tip:

Use A/B testing to find the ingredients for maximum impact.

The right image can make or break conversions, so test different options. Some images resonate better with your audience, drive more engagement, or feel more aligned with your brand.

Some elements to test include:

  • People vs. product-focused visuals.
  • Static images vs. motion (GIFs or videos).
  • Close-ups vs. wider perspective shots.
  • Different background colors or lighting.

5 & 6. Serene Vista & Digital Foundry: Great For Clearly Conveying Benefits

Visitors specifically care about what it does for them.

That’s why benefits should take center stage on a conversion-optimized landing page, not just a list of features.

Serene Vista

Travel website landing page inspirationImage by Unbounce, 2025

The Digital Foundry Landing Page

Marketing agency landing page inspirationImage by Unbounce, 2025

Why They Work

  • The benefits are concise and audience-focused
  • Each feature section is well-spaced to garner attention
  • Benefits are integrated well into the page structure with the subheadings and images to help visitors scan

How To Recreate These Landing Pages

Step 1: Translate Features into Benefits

  • Feature: “AI-powered keyword research tool”
  • Benefit: “Find high-converting keywords in seconds—no guesswork needed.”

Step 2: Address Pressing Concerns

  • What pain points does your audience face?
  • How does your product solve them better than competitors?

Step 3: Qualify Your Audience

  • Use benefit-driven copy that attracts the right people:
  • Example: “Perfect for fast-growing teams who need to scale without the chaos.”

7 & 8. Revive Aesthetics & Smile Dental: Great For Social Proof That Builds Trust

Not all social proof is created equal.

The best reinforces your UVP, addresses concerns, and speaks directly to your audience.

See what we mean here.

Revive Landing Page

Health and spa landing page inspirationImage by Unbounce, 2025

Smile Kids Landing Page

Dentist landing page inspirationImage by Unbounce, 2025

Why These Landing Page Templates Work

  • The headshots paired with the social proof enhance trustworthiness and make a connection with site visitors because they can see themselves in the experiences being described.
  • The rounded shape and contrasting colors make the social proof stand out.
  • Located near the point of conversion.

How To Create This Landing Page

Step 1: Choose the Right Type of Social Proof

  • Customer testimonials & reviews
  • Case studies & success stories
  • Logos of recognizable brands
  • Ratings & review scores
  • Media mentions & awards

Step 2: Strategically Place Social Proof

  • Near the CTA: Reinforces trust before action.
  • Midway down the page: Nudges hesitant visitors.
  • In the hero section: Puts endorsements front and center.

9 & 10. Livewell Lifestyle & Inner Handyman: Great For Turning Interest Into Conversions With Calls To Action

A landing page without a strong CTA is like a roadmap without a destination.

Your CTA is the single most important element that tells visitors what to do next.

And if it’s unclear, compelling, and easy to find, you’ll lose conversions.

A compelling CTA is a combination of copy, design, and placement that removes hesitation and drives action.

Livewell Landing Page

Healthy living landing page exampleImage by Unbounce, 2025

Inner Handyman Landing Page

Local business landing page and website inspirationImage by Unbounce, 2025

Why They Work

  • CTAs can be customized to stand out and get attention
  • CTA sizing and positioning make them clear focal points despite having multiple elements on the page. It ensures you get the most conversion power in every pixel
  • The CTA buttons are placed where it matters throughout the page, making sure the page attempts the conversion when and where it matters most

How To Recreate These Landing Pages

Step 1: Craft a Clear, Compelling CTA

A high-converting CTA should be:

  • Action-oriented: “Start Growing Today” vs. “Submit”
  • Benefit-driven: “Unlock Exclusive Access” vs. “Sign Up”
  • Urgent (if appropriate): “Claim Your Spot Today”

Step 2: CTA Placement for Maximum Impact

  • Above the fold: First CTA visible immediately.
  • After key information: CTA follows value explanation.
  • Near social proof or benefits: Reinforces trust.
  • At the end of the page: Captures hesitant visitors.

Step 3: CTA Design That Stands Out

  • Color contrast: The CTA should pop from the background.
  • Size & positioning: Large enough to be noticeable but not overwhelming.
  • Whitespace & directional cues: Ensures the CTA is the focal point.

Bonus Tip:

A/B test your CTAs for better conversions.

CTAs aren’t one-size-fits-all. Even small tweaks can make a huge impact on conversions, so A/B testing different variations is essential:

  • Wording – Try “Get Started” vs. “Try It Free”
  • Color – A bold button color vs. a softer, branded one
  • Placement – Above the fold vs. midway down the page
  • Size and shape – Larger buttons vs. compact ones
  • Personalization – “Start My Free Trial” vs. “Start Your Free Trial”

Build High-Converting Landing Pages Faster

A great landing page isn’t just about design.

It’s about strategy.

Every element, from your USP and hero images to your social proof and CTAs, is critical in guiding visitors toward conversion. When these elements work together, your landing page drives action.

But building a high-converting landing page from scratch can be time-consuming and complex. That’s why using proven, conversion-optimized templates can give you a head start.

With Unbounce, you get access to 100+ professionally designed landing page templates built for maximum conversions. Whether capturing leads, promoting a product, or running a campaign, these templates help you launch faster, test smarter, and convert better—without needing a developer.

Ready to build an optimized landing page that converts?

Explore Unbounce’s best-performing templates and start optimizing today!


Image Credits

Featured Image: Image by Shutterstock. Used with permission.

Optimizing Interaction To Next Paint (INP): A Step-By-Step Guide via @sejournal, @DebugBear

This post was sponsored by DebugBear. The opinions expressed in this article are the sponsor’s own.

Keeping your website fast is important for user experience and SEO.

The Core Web Vitals initiative by Google provides a set of metrics to help you understand the performance of your website.

The three Core Web Vitals metrics are:

This post focuses on the recently introduced INP metric and what you can do to improve it.

How Is Interaction To Next Paint Measured?

INP measures how quickly your website responds to user interactions – for example, a click on a button. More specifically, INP measures the time in milliseconds between the user input and when the browser has finished processing the interaction and is ready to display any visual updates on the page.

Your website needs to complete this process in under 200 milliseconds to get a “Good” score. Values over half a second are considered “Poor”. A poor score in a Core Web Vitals metric can negatively impact your search engine rankings.

Google collects INP data from real visitors on your website as part of the Chrome User Experience Report (CrUX). This CrUX data is what ultimately impacts rankings.

Image created by DebugBear, May 2024

How To Identify & Fix Slow INP Times

The factors causing poor Interaction to Next Paint can often be complex and hard to figure out. Follow this step-by-step guide to understand slow interactions on your website and find potential optimizations.

1. How To Identify A Page With Slow INP Times

Different pages on your website will have different Core Web Vitals scores. So you need to identify a slow page and then investigate what’s causing it to be slow.

Using Google Search Console

One easy way to check your INP scores is using the Core Web Vitals section in Google Search Console, which reports data based on the Google CrUX data we’ve discussed before.

By default, page URLs are grouped into URL groups that cover many different pages. Be careful here – not all pages might have the problem that Google is reporting. Instead, click on each URL group to see if URL-specific data is available for some pages and then focus on those.

Screenshot of Google Search Console, May 2024

Using A Real-User Monitoring (RUM) Service

Google won’t report Core Web Vitals data for every page on your website, and it only provides the raw measurements without any details to help you understand and fix the issues. To get that you can use a real-user monitoring tool like DebugBear.

Real-user monitoring works by installing an analytics snippet on your website that measures how fast your website is for your visitors. Once that’s set up you’ll have access to an Interaction to Next Paint dashboard like this:

Screenshot of the DebugBear Interaction to Next Paint dashboard, May 2024

You can identify pages you want to optimize in the list, hover over the URL, and click the funnel icon to look at data for that specific page only.

Image created by DebugBear, May 2024

2. Figure Out What Element Interactions Are Slow

Different visitors on the same page will have different experiences. A lot of that depends on how they interact with the page: if they click on a background image there’s no risk of the page suddenly freezing, but if they click on a button that starts some heavy processing then that’s more likely. And users in that second scenario will experience much higher INP.

To help with that, RUM data provides a breakdown of what page elements users interacted with and how big the interaction delays were.

Screenshot of the DebugBear INP Elements view, May 2024

The screenshot above shows different INP interactions sorted by how frequent these user interactions are. To make optimizations as easy as possible you’ll want to focus on a slow interaction that affects many users.

In DebugBear, you can click on the page element to add it to your filters and continue your investigation.

3. Identify What INP Component Contributes The Most To Slow Interactions

INP delays can be broken down into three different components:

  • Input Delay: Background code that blocks the interaction from being processed.
  • Processing Time: The time spent directly handling the interaction.
  • Presentation Delay: Displaying the visual updates to the screen.

You should focus on which INP component is the biggest contributor to the slow INP time, and ensure you keep that in mind during your investigation.

Screenshot of the DebugBear INP Components, May 2024

In this scenario, Processing Time is the biggest contributor to the slow INP time for the set of pages you’re looking at, but you need to dig deeper to understand why.

High processing time indicates that there is code intercepting the user interaction and running slow performing code. If instead you saw a high input delay, that suggests that there are background tasks blocking the interaction from being processed, for example due to third-party scripts.

4. Check Which Scripts Are Contributing To Slow INP

Sometimes browsers report specific scripts that are contributing to a slow interaction. Your website likely contains both first-party and third-party scripts, both of which can contribute to slow INP times.

A RUM tool like DebugBear can collect and surface this data. The main thing you want to look at is whether you mostly see your own website code or code from third parties.

Screenshot of the INP Primary Script Domain Grouping in DebugBear, May 2024

Tip: When you see a script, or source code function marked as “N/A”, this can indicate that the script comes from a different origin and has additional security restrictions that prevent RUM tools from capturing more detailed information.

This now begins to tell a story: it appears that analytics/third-party scripts are the biggest contributors to the slow INP times.

5. Identify Why Those Scripts Are Running

At this point, you now have a strong suspicion that most of the INP delay, at least on the pages and elements you’re looking at, is due to third-party scripts. But how can you tell whether those are general tracking scripts or if they actually have a role in handling the interaction?

DebugBear offers a breakdown that helps see why the code is running, called the INP Primary Script Invoker breakdown. That’s a bit of a mouthful – multiple different scripts can be involved in slowing down an interaction, and here you just see the biggest contributor. The “Invoker” is just a value that the browser reports about what caused this code to run.

Screenshot of the INP Primary Script Invoker Grouping in DebugBear, May 2024

The following invoker names are examples of page-wide event handlers:

  • onclick
  • onmousedown
  • onpointerup

You can see those a lot in the screenshot above, which tells you that the analytics script is tracking clicks anywhere on the page.

In contrast, if you saw invoker names like these that would indicate event handlers for a specific element on the page:

  • .load_more.onclick
  • #logo.onclick

6. Review Specific Page Views

A lot of the data you’ve seen so far is aggregated. It’s now time to look at the individual INP events, to form a definitive conclusion about what’s causing slow INP in this example.

Real user monitoring tools like DebugBear generally offer a way to review specific user experiences. For example, you can see what browser they used, how big their screen is, and what element led to the slowest interaction.

Screenshot of a Page View in DebugBear Real User Monitoring, May 2024

As mentioned before, multiple scripts can contribute to overall slow INP. The INP Scripts section shows you the scripts that were run during the INP interaction:

Screenshot of the DebugBear INP script breakdown, May 2024

You can review each of these scripts in more detail to understand why they run and what’s causing them to take longer to finish.

7. Use The DevTools Profiler For More Information

Real user monitoring tools have access to a lot of data, but for performance and security reasons they can access nowhere near all the available data. That’s why it’s a good idea to also use Chrome DevTools to measure your page performance.

To debug INP in DevTools you can measure how the browser processes one of the slow interactions you’ve identified before. DevTools then shows you exactly how the browser is spending its time handling the interaction.

Screenshot of a performance profile in Chrome DevTools, May 2024

How You Might Resolve This Issue

In this example, you or your development team could resolve this issue by:

  • Working with the third-party script provider to optimize their script.
  • Removing the script if it is not essential to the website, or finding an alternative provider.
  • Adjusting how your own code interacts with the script

How To Investigate High Input Delay

In the previous example most of the INP time was spent running code in response to the interaction. But often the browser is already busy running other code when a user interaction happens. When investigating the INP components you’ll then see a high input delay value.

This can happen for various reasons, for example:

  • The user interacted with the website while it was still loading.
  • A scheduled task is running on the page, for example an ongoing animation.
  • The page is loading and rendering new content.

To understand what’s happening, you can review the invoker name and the INP scripts section of individual user experiences.

Screenshot of the INP Component breakdown within DebugBear, May 2024

In this screenshot, you can see that a timer is running code that coincides with the start of a user interaction.

The script can be opened to reveal the exact code that is run:

Screenshot of INP script details in DebugBear, May 2024

The source code shown in the previous screenshot comes from a third-party user tracking script that is running on the page.

At this stage, you and your development team can continue with the INP workflow presented earlier in this article. For example, debugging with browser DevTools or contacting the third-party provider for support.

How To Investigate High Presentation Delay

Presentation delay tends to be more difficult to debug than input delay or processing time. Often it’s caused by browser behavior rather than a specific script. But as before, you still start by identifying a specific page and a specific interaction.

You can see an example interaction with high presentation delay here:

Screenshot of the an interaction with high presentation delay, May 2024

You see that this happens when the user enters text into a form field. In this example, many visitors pasted large amounts of text that the browser had to process.

Here the fix was to delay the processing, show a “Waiting…” message to the user, and then complete the processing later on. You can see how the INP score improves from May 3:

Screenshot of an Interaction to Next Paint timeline in DebugBear, May 2024

Get The Data You Need To Improve Interaction To Next Paint

Setting up real user monitoring helps you understand how users experience your website and what you can do to improve it. Try DebugBear now by signing up for a free 14-day trial.

Screenshot of the DebugBear Core Web Vitals dashboard, May 2024

Google’s CrUX data is aggregated over a 28-day period, which means that it’ll take a while before you notice a regression. With real-user monitoring you can see the impact of website changes right away and get alerted automatically when there’s a big change.

DebugBear monitors lab data, CrUX data, and real user data. That way you have all the data you need to optimize your Core Web Vitals in one place.

This article has been sponsored by DebugBear, and the views presented herein represent the sponsor’s perspective.

Ready to start optimizing your website? Sign up for DebugBear and get the data you need to deliver great user experiences.


Image Credits

Featured Image: Image by Redesign.co. Used with permission.

5 Awesome Spreadsheet Apps For the iPhone via @sejournal, @JuliaEMcCoy

It really does seem there’s an app for everything these days.

For your music, your workouts… even to find someone to walk your dog. For whatever fantastical use you can dream up, there’s an app for it.

And spreadsheets are no exception.

But with a sea of spreadsheet apps available for iPhone users, how do you choose the right one? In the end, there’s no best spreadsheet app. However, with a bit of digging and a little help, it’s possible to find the best one for you.

Finding a Great Spreadsheet App Is Easy

Getting personal or professional business done no longer means you’re locked in front of a desktop computer all day.

Sore from sitting down for eight hours a day? Dying for a change of scenery? Need to stay on the go?

The answer you’re looking for may be in an app.

Sure, you’re working with a smaller screen and spreadsheet apps won’t always be for everyone. However, their easy accessibility and portability make them ideal for some.

Not only are there a vast amount of spreadsheet apps available today but they’re high quality, too. It’s quick and easy to find an app to suit your needs.

What to Look for in Spreadsheet Apps

Which app is best for you depends on what you want to get out of it. Do you have a large business and require robust customization and many functions? You probably need Microsoft Excel’s app.

Newbie working on a budget who needs something simple that works? Apple Numbers is likely more up your alley.

When choosing the best app for your spreadsheet needs, consider the following:

  • Learning curves.
  • Budget.
  • The number of features and functions required.
  • Storage needs.

Knowing what your needs are is the first step to choosing the best spreadsheet app for you.

What’s the Best Spreadsheet App for iPhone?

The number of apps out there can be simply overwhelming.

To help you out, here’s a list of my top five spreadsheet apps with their pros and cons.

1. Microsoft Excel

Microsoft ExcelImage from Microsoft, April 2024

Cost: ~$100/yr

Pros:

  • Large number of functions.
  • Extremely customizable charts.
  • Great for collaboration.

Cons:

  • Steep learning curve.

Microsoft Excel now has an app available on iOS and Android.

Worry not. Just because Excel is now also an app doesn’t mean it doesn’t have high functionality.

Compared to other spreadsheet apps, Microsoft Excel does come at a steep price as you’ll need a license to use it. Depending on your needs, however, this app may still be well worth it.

Work with a team you need to communicate with?

Excel has solid collaboration features that make things easy, including comments and history tracking. Its massive number of functions make it a huge competitor on this list for those who require them.

The downside? With all of its functionality and ways to use it, the Microsoft Excel app comes with a steep learning curve. Because of this, it may not be the best spreadsheet app for beginners.

Looking for something a looking simpler? Keep reading.

2. Google Sheets

Image from Google Sheets, April 2024

Cost: Free up to 15 GB of storage

Pros:

  • No software needed.
  • Easy to use.
  • Formula tooltip.

Cons:

  • Can’t make as many chart types as Excel.
  • Charts can’t be edited outside of the app.

It’s neck-and-neck with Microsoft Excel for being one of the greatest spreadsheet apps out there. Google Sheets offers various unique benefits.

Two features are at the top of the list: its cost and storage.

Yes, Google Sheets is completely free for up to 15 GB of storage. Even if you require more extensive storage, their rates are fairly reasonable.

Also unique from Excel is Google Doc’s cloud storage. There’s no need to clog up your device with documents.

Another bonus? There isn’t any software to download.

Google Sheets also has fantastic collaboration tools, including chat, comments, real-time co-editing, and simple sharing. Here’s another app that can keep you effortlessly connected.

For newbies, Google Sheets is going to be your ideal app. It has an interface that’s easy to use – plus a clean interface that’s pleasing to the eye.

On top of that, Sheets comes with a helpful formula tooltip to provide definitions and arguments.

Google Sheets, just like any app, isn’t perfect. There aren’t quite as many types of charts as Excel, and they can’t be edited outside the app, as in Word.

Still, it has a great number of useful functions for a free app.

3. Apple Numbers

Apple NumbersImage from Apple Numbers, April 2024

Price: Free (comes pre-installed on Macbooks)

Pros:

  • Clean, modern interface.
  • Comes equipped with templates.

Cons:

  • Lacks some key features.
  • Not available for Android.

Many use the Apple Numbers app for one reason: it comes already pre-installed on their Macbooks. Even better, the app is free even if you don’t have a Macbook.

However, Apple Numbers is predictably only available for iOS. That’s a bummer for Android users.

Many have applauded Apple Numbers for its sleek look. Numbers loads as an infinite blank canvas you can place tables onto, in stark contrast to Excel’s busy, pre-made design.

This is another great choice for beginners starting to use spreadsheets. Apple Numbers comes equipped with pre-built templates to help you quickly finish everyday tasks.

On the negative side, this spreadsheet app does not come with data analysis compatibility and is not able to manage large data sets.

Therefore, Apple Numbers may not be the best choice for business owners who need to process a large amount of data.

4. LibreOffice

LibreOfficeScreenshot from LibreOffice, April 2024

Price: Free

Pros:

  • Completely free and open source.
  • Simple-to-create graphs.
  • Easy function building.

Cons:

  • No collaborative tools.
  • Interface is outdated.

A community-driven and developed software, LibreOffice was created by The Document Foundation as a not-for-profit project. Their goal was to create accessible software that everyone could use, and they largely succeeded.

LibreOffice is open source, meaning it’s made freely available and can be modified or redistributed. This also means the app is fantastic for those seeking to customize their app who are on a tight budget.

The app additionally boasts the ability to process large amounts of information.

Another app that works well for beginners, LibreOffice has made function building painless with an easy step-by-step guide. Graphs are also simple to create; you no longer have to pull your hair out while working on what should be a simple product.

On the downside, as it hasn’t been updated in a while, the interface is outdated with a cluttered view. This makes the app more cumbersome to navigate.

Still, you have to remember LibreOffice has about 300 features, all stuffed into one app. It’s going to be a little cluttered.

5. Zoho Sheets

ZohoImage from Zoho Sheets, April 2024

Price: Free (up to 5 GB)

Pros:

  • Has many functions.
  • Easily imports data.
  • Great formula builder.

Cons:

  • Advanced features are hidden in menus.
  • Fewer chart types.

Last on the list, but not least, Zoho Sheets has much to offer. It has a ton of available functions and easily imports data, including feeds.

The app also has a noteworthy formula builder with function descriptions, unlike Google Sheets. On the other hand, like Google Sheets, it’s free (up to a point) and cloud-based, so you can save storage on your device.

Even Microsoft Excel is given a run for its money when it comes to functions.

Zoho Sheet features over 350 functions, fiercely challenging their primary rival, Excel. This app also has some fantastic collaboration features, including; chat, real-time co-authoring, and sharing permissions.

Their charts have upsides and downsides. Although Zoho Sheets has fewer chart types than some of its competitors, the charts they do have are easy to create and customize. Not perfect for those who need to do more intricate projects, but suitable for a newbie.

Where Zoho Sheet falters is their navigability. Many advanced features are hidden in the menus, making them arduous to access. Work may be slower, although you’ll have access to more tools.

Conclusion

In a quickly evolving work scene, it can feel hard to catch up. Why not let an app make your life easier?

Spreadsheet apps can be perfect for business owners, workers, or anyone who really just needs to stay organized.

Depending on what you can afford, what functions you need, and what storage, there’s going to be a perfect app for you somewhere out there.

It’s all a numbers game.

More Resources:


Featured Image: Andrey_Popov/Shutterstock

FAQ

What factors should you consider when choosing a spreadsheet app for iPhone?

With the numerous spreadsheet applications available for iPhone users, selecting the right one hinges on several key considerations. It is vital to assess your unique requirements and preferences to make an informed choice. Here are the integral factors to bear in mind:

  • Learning Curve: How easy is the app to use, and how much time are you willing to invest in learning it?
  • Budget: What is your financial threshold? Free apps may suffice for basic needs, while paid versions offer more advanced features.
  • Features and Functions: Determine the complexity of the functions you need for your tasks. Some may need robust customization options for extensive data manipulation.
  • Storage Needs: Assess the amount of data you plan to handle and whether the app provides adequate storage options, either locally or in the cloud.

How does Microsoft Excel’s app for iPhone cater to collaborative needs?

Microsoft Excel’s app for iPhone is designed to accommodate the collaborative needs of various user groups, which is particularly beneficial for teams that require strong communication channels. Key features include:

  • Collaborative Tools: Real-time co-editing, comments, and history tracking enable team members to work together effectively from different locations.
  • Cloud Integration: With cloud capabilities, sharing updates and accessing the latest version of a document can be done seamlessly.
  • High Functionality: Excel’s wide array of functions makes it suitable for handling complex datasets and various analytical tasks, which are crucial for enterprise-level collaboration.

What advantages does Google Sheets offer over other spreadsheet apps?

Google Sheets stands out among spreadsheet apps due to its unique combination of features and accessibility. Here are the advantages that elevate its user experience:

  • Cost and Storage: Google Sheets is free for up to 15 GB of storage, with reasonable pricing for additional space.
  • Cloud-Based: It operates entirely in the cloud, negating the need for local storage on your device.
  • Accessibility: No software downloads are required, making it readily accessible across multiple devices.
  • Collaboration: Stellar collaborative tools like chat functionality, real-time co-editing, and easy sharing options streamline teamwork.
  • User-Friendly Interface: With an intuitive and aesthetically pleasing interface, Google Sheets is ideal for beginners and those who appreciate simplicity.

Are there any downsides to using Apple Numbers on the iPhone?

While the Apple Numbers app is renowned for its ease of use and sleek design, there are some limitations to consider before adopting it as your go-to spreadsheet app:

  • Limited Feature Set: Certain advanced features may be lacking, which could hinder complex data analysis.
  • Platform Restrictions: Apple Numbers is only available on iOS, excluding Android users from its potential user base.
  • Data Handling Limitations: The app is not ideally suited for managing large datasets, which could be a significant drawback for business owners and power users.

Amazon Sellers: Inventory Tips & Tactics For 2024 Success via @sejournal, @AMZRobynJohnson

Inventory has always played a significant role in the way you sell on Amazon.

Running out of inventory can impact your organic ranking and can impact your advertising strategy.

Besides the potential loss of sales, poor inventory control also impacts the amount of inventory Amazon will allow you to send into the Fulfillment by Amazon (FBA) program.

Keep reading to learn more about:

  • How your Inventory Performance Index (IPI) score impacts your available storage volume.
  • What the IPI is, and how it’s calculated.
  • Recommended actions for improving your IPI score.
  • Tips for Amazon sellers who are new to Seller Central.

Amazon Limiting Sellers Storage Based On Storage Utilization

Amazon controls your storage capacity limits based on storage utilization and your sales history: 

Total Capacity Limit

This limits the amount of inventory you can restock to Amazon’s FBA warehouses in one shipment and the overall maximum number of units you can store at Amazon.

Accounts that have been active for less than 39 weeks are not subject to these restrictions.

It is important to note that this is only true for those accounts on the Professional Seller Plan.  Those with individual Seller Plans are limited to 15 cubic feet per month.

This limits the maximum cubic feet of storage space you have at Amazon. These limits are reviewed and adjusted monthly.

Any changes you can expect for your storage capacity for the following month will be announced on the third Monday of the month.

Included in your storage usage are the inventory currently stored at Amazon, inventory en route to Amazon, and any shipments that have been prepared but not yet sent to Amazon.
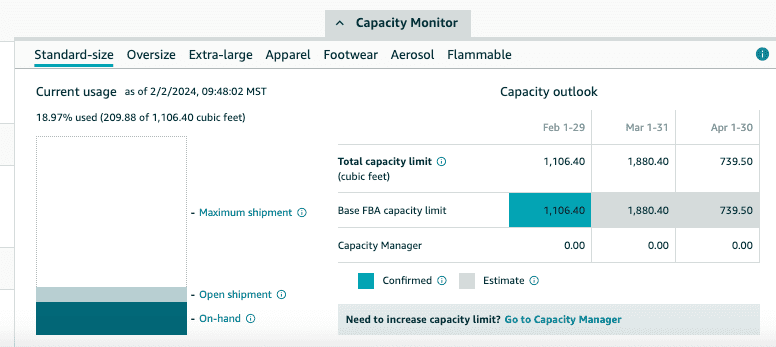
Screenshot of storage capacity monitor on Amazon Seller Central. Screenshot from Amazon Seller Central, February 2024

The Storage Volume is highly impacted by your IPI (Inventory Performance Index).

We will further discuss how your IPI is calculated later in this article.

IPIScreenshot from Amazon Seller Central, February 2024

Sellers who fall below the minimum criteria can have their storage limited. Operating with such limited storage can significantly undermine your sales forecasts.

We will outline the steps you can take to ensure you have sufficient storage for your high-demand season, maximizing your sales on Seller Central.

We’ll also review what you can do if you fall below Amazon’s set criteria.

You can find your limit by going to Seller Central, selecting Inventory, navigating to the Inventory Dashboard, and then selecting Inventory Performance under the dropdown for Inventory.
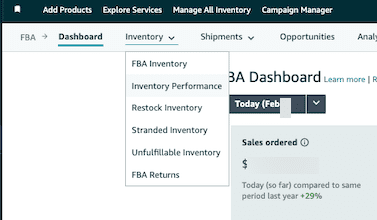
Screenshot of how to navigate to find your storage capacity on Amazon. Screenshot from Amazon, February 2024

Your IPI score will be near the top of the page.

To reach your storage capacity, scroll to the bottom of the page and click on the small gray box labeled Capacity Monitor.

Success on Amazon Means You Have To Manage Your Inventory Levels Proactively

Amazon says that it considers the following criteria for your storage levels:

  • IPI Score and Sales Performance: Higher storage capacities are granted to accounts that consistently achieve a high IPI score.
  • Storage Utilization: In determining storage limits, Amazon considers your current inventory, inbound inventory, and shipments that are prepared but not yet dispatched.
  • Sales Volume: Amazon will also look at sales volume over time.

Improving Your IPI

If you have a low IPI score, know it will take time to improve your score.

IPI is a rolling average. It can take anywhere from 2 to 12 weeks to increase your score on Amazon, so planning ahead of time is essential.

This means if your IPI is below the 400 Amazon requires, you need to start taking aggressive action today.

This article will outline how to avoid having detrimental storage limits, how it happens, and what to do when you’re already below the threshold.

For those interested in Restock Limits, we’ll explore this topic in more detail later in the guide.

What Is The IPI (Inventory Performance Index), And Does It Affect Me?

The IPI will only affect those using Seller Central and FBA warehouses.

It does not affect those using Vendor Central, Kindle Direct Platform, or those selling on Seller Central by Merchant Fulfilling or utilizing Seller Fulfilled Prime for their items.

Inventory Performance Index (IPI)

The Inventory Performance Index (IPI) manages how well you control and manage your inventory at Amazon.

This metric is a 12-week rolling average. It looks at several components over three months.

Four components make up the Inventory Performance Index (IPI):

Excess Inventory

This is the most important metric as it measures where your profitability may take a hit due to storage fees and holding costs for slow-moving FBA inventory.

Excess Inventory percentages help sellers plan when to restock more or remove inventory from FBA.

An item is considered to have excess inventory when it has over 90 days of supply based on the forecasted demand. 

Sell Through Rate

This metric is just how it sounds. The formula that Amazon uses to calculate Sell Through rates is:

(Units Shipped In the Last 90 Days)/(Average Units on Hand Over the Last 90 days)

Stranded Inventory

This provides information on products that aren’t selling due to listing issues.

This occurs when your listing doesn’t meet Amazon guidelines.

In these instances, your products become stranded and unable to move while still incurring FBA storage fees.

In-Stock Inventory

Amazon looks at the percentage of time your products have been in stock during the past 30 days, with additional weight given to items that have sold more units over the past 60 days.

If you maintain a high in-stock inventory, it will result in fewer lost sales.
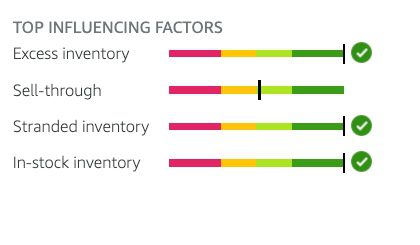
Four components of the Inventory Performance Index.Screenshot from author, February 2024

It is important to highlight that these components are not weighted equally.

Excess Inventory

Excess Inventory and Sell-Through Rate are the parameters that have the most significant impact on IPI, while Stranded Inventory and Restock Rates can play a minor role in the overall score.

This means you will get more movement focusing solely on the first two components rather than spreading your efforts equally across all four elements.

During the height of the pandemic, Amazon changed the minimum IPI to 500. IT has since reduced the minimum IPI back to 400.

However, Amazon can increase or decrease the minimum IPI desired score at any point in time.

For this reason, we advise our clients to aim for a total IPI of 600.

Your minimum goal should be achieving at least 50 points over the current IPI requirement.

Some product mixes make maintaining a high IPI easier than others. For example, if you are a small brand with many products that move consistently, your IPI will generally tend to be higher.

If you are a seller with a large product mix that changes often, it is the most challenging to manage.

Combatting Capacity Limits

If you’re currently experiencing a capacity limit, Amazon can increase your capacity limit for a specific period of time by submitting a request subject to Amazon’s approval.

It is important to remember that if the storage limit increase request gets approved, your account is subject to paying a “reservation fee” for each cubic foot of capacity requested, and it will get charged at the end of the specified period.

Such fee is subject to a credit depending on your sales achieved during the period (performance credits are earned at $0.15 for every dollar of sales you generate using the additional capacity.)

Another alternative is to continue selling items via merchant fulfillment or using other third-party sellers to move your inventory or send small shipments of your fastest, most profitable inventory to Amazon.

Further down in this article, we will highlight what you can do when your inventory performance is low, you are facing potential inventory limits, or if you’re new to Amazon.

Why Would Amazon Do This?

It seems like it would be counterintuitive for a company that is so focused on having as many products on its platform as possible to limit the amount of inventory you could sell.

However, as more sellers joined the platform and with rising FBA and Prime offers, overcrowding at the warehouses started to become a larger problem for Amazon.

Amazon sellers were attracted to FBA because of the low cost of storage rates. Sellers were using the FBA program as a cheap way to warehouse large amounts of inventory.

At first, Amazon tried to increase storage fees. Adding long-term storage fees dramatically increased the storage cost for merchandise aged over six months.

However, even with those changes, Amazon couldn’t curve the overcrowding and demand in its FBA warehouses.

As a result, it started to introduce storage limits in 2019.

From Amazon’s perspective, it wants to ensure customers have favorable shopping experiences and quickly get the products they want.

This means ensuring that the products most likely to sell are available.

Amazon looks at how you have managed inventory in the past and whether customers are purchasing your products to determine how much space is allocated to you.

The better Amazon feels you are at managing your space at Amazon’s FBA warehouses, the more storage space you will be allowed.

What If My IPI Is Below The Current Threshold?

If your IPI is currently below the threshold or within 50 points of the lowest threshold, these are the actions we recommend.

The first step is to check the current threshold. As of the writing of this article, the current threshold for IPI is 400.

However, here’s the direct link to the policy so you can find the current threshold, as Amazon can change this at any time. You can find the current required IPI in Seller Support under the heading FBA Inventory Storage Limits (login required).

You can review your current IPI score in Seller Central by going to Inventory, Inventory Planning, and then clicking on your IPI score.
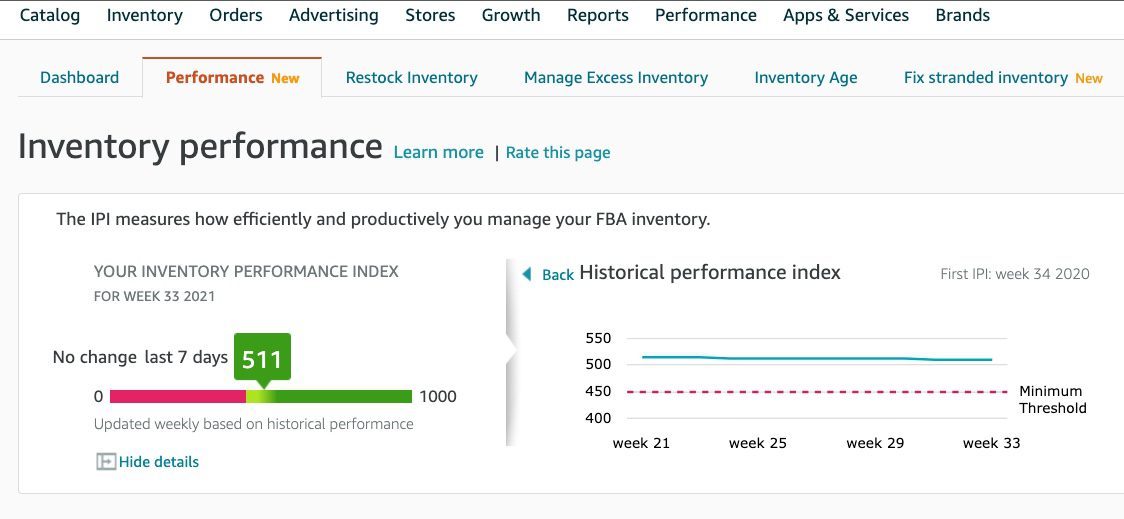
IPI score in Seller Central.Screenshot from Amazon Seller Central, February 2024

Even with aggressive tactics, changing the IPI significantly can take 2 to 12 weeks.

Recommended Actions To Improve Inventory Performance Index (IPI)

Excess Inventory – Dump Slow Moving Items

Excess inventory is generally one of the top two reasons your IPI score could be low, since it is the most heavily weighted metric.

The first step to addressing excess inventory is to pull back inventory you don’t expect to sell.

Focus on stock-keeping units (SKUs) that have gone out of fashion or merchandise experiencing a significant demand drop, like seasonal products.

If you don’t expect it to sell within three months, you should pull back the inventory to sell on a different channel by creating a removal order.

You can also start to use the Multi-Channel Fulfillment (MCF) to fulfill your website orders from your Amazon stock.

Sometimes, it makes more sense to discount and/or advertise products to help them sell faster to remove them from your inventory rather than call back inventory from Amazon.

Optimizing a listing that is not moving can also help increase the sell-through rate.

A quick note on having Amazon destroy products – sometimes, the company will liquidate that product instead of destroying it.

If inventory control is an essential factor for your brand, we recommend pulling back the inventory even though it costs more.

While Amazon is great at logistics and moving items through its process, it isn’t great at returning items to sellers.

Often, items arrive damaged or mixed SKUs in multiple boxes, clogging up receiving departments.

If possible, we want to ensure that we’re proactively taking action to avoid pulling back inventory and risk inventory being damaged or unavailable to be sold for a long time.

Sell-Through Rate – Send Fast-Moving Items

Amazon looks at this to identify whether the items you’re selling are things customers want to purchase.

The way that we improve the sell-through rate is to send in small shipments of items that will sell out very quickly.

If you’re currently using LTL or FTL, we recommend that you move to small parcel shipments during this process so that you can send more frequent shipments without going out of stock for long periods.

As you’re restocking items, you want to prioritize those that will move quickly, sending small quantities of items that will sell out as soon as they arrive or shortly after.

This allows your overall sell-through rate to increase dramatically and significantly impact your overall IPI.

It is vital that no matter how fast you think a product will move through, as you send these products in, you’re testing small batches to make sure that things will sell at the pace you anticipate.

Stranded Inventory

Inventory that’s being held in FBA warehouses and not available for sale affects your overall IPI.

Fixing stranded inventory can make a slight difference; however, if you need to move your IPI significantly, this component of the overall metric will only make a slight difference.

It would be best to address stranded inventory weekly or bi-weekly, depending on your general sell-through rate.

In-Stock Inventory

This is probably the most frustrating metric of the IPI because, basically, Amazon is telling you that you can’t restock items because they’re not selling fast enough.

At the same time, it’s trying to encourage you to ensure you stay in stock.

We have found that this metric is very lightly weighted, and you’re better off focusing on the two key metrics of excess inventory and sell-through rate.

There has been some debate about whether deleting previous SKUs can increase this; however, we have not seen that this significantly impacts the total IPI.

General IPI Notes

As you’re working to increase your overall IPI, it is important to remember that it can take several weeks to increase.

The IPI is an average calculated over 12 weeks.

You must give the IPI enough time to move before determining whether your actions are making a difference.

It can be tempting to check your IPI often. However, your IPI score is only recalculated once a week.

If you need to raise your IPI quickly or by a significant amount, you may need to take overly aggressive actions in pruning your inventory and pumping fast-moving items through your account to increase your score to the required amount.

You might have to also bid for a capacity increase.

You should only do this if you have the data to support being able to sell through that higher quantity of items so you do not incur extra charges.

Additional Options To Combat Low IPI and Storage Capacity Issues

Sometimes, this means utilizing third-party sellers to ensure that inventory can be available to customers with a Prime offer.

Some of the brands we work with have focused on selling their fastest-moving SKUs while they improve their overall IPI score and capacity limits.

Then, they utilized third-party sellers to carry their slower-moving items while they worked on increasing their averages.

We have several reliable third-party resellers we refer our clients to if it’s ever an issue.

This means that those accounts saw a faster increase in storage capacity as they were sending in inventory that was selling at a much faster rate and restocking regularly.

If you don’t want to utilize third-party sellers, the alternative is to increase your total number of merchant-fulfilled offerings.

Remember that Merchant Fulfilled offerings generally don’t compete well against FBA offers, so watch your competition to determine feasibility.

While many brands avoid third-party sellers because it may reduce control over their brand, in this instance, it can be an excellent tool to ensure that you don’t lose potential market share to other competing product lines.

Another step you can take is to allocate your FBA warehouse space to items with the highest margin and smallest dimensional size, as they are highly profitable and sell quickly.

Leaving items with lower profitability or moving slower through Merchant Fulfilled (MF).

Tips For New Amazon Sellers

If you’re a new seller coming to Amazon or moving from Vendor Central to Seller Central, start by sending small quantities at first.

You have a grace window of 39 weeks when opening your account.

However, you want to ensure you send in small amounts of inventory. A few cases per product can help you identify the overall sell-through rate.

There is no minimum for sending inventory into Amazon FBA. So, it is possible to test as little as one unit at a time to test products on Amazon.

Sending in small shipments does increase your overall shipping cost and can reduce profitability in the short term.

However, when you’re first investigating the platform, sending in smaller quantities can help you better understand your product’s demand and help avoid additional fees that can be required to call inventory back or pay for storage fees.

Once you have a better idea of your sell-through rate, you can start to increase the total sizes of your inventory.

It is a delicate balance to have enough inventory so that you don’t run out of stock but also that you don’t have excess inventory.

While, in general, you want to aggressively avoid stockouts, the impact of a low IPI score should take priority.

Monitoring Inventory Matters

To succeed on the platform, you must take an active role in your Amazon inventory management.

In prior years, simply avoiding restocks was enough.

However, these new requirements require a greater focus on monitoring your sell-through rate and storage utilization on Amazon.

Prepare now to support your Amazon marketing and sales goals for the coming holiday season.

More Resources:


Featured Image: Piscine26/Shutterstock

Airbnb Acquires GamePlanner.AI To Accelerate AI Projects via @sejournal, @kristileilani

Airbnb announced its acquisition of AI startup GamePlanner.AI.

Brian Chesky, CEO and co-founder of Airbnb, highlighted the startup’s unique capabilities: “What makes GamePlanner.AI so special is that they combine expertise in AI, design, and community.”

Chesky underlined the transformative potential of AI and stressed Airbnb’s dedication to ensuring AI augments humanity positively. “AI will rapidly alter our world more than any other technology in our lifetime,” he said. “Together with Adam and his team, we can develop some of the best interfaces and practical applications for AI.”

How To Reduce Your Email Bounce Rate & Boost Email Marketing Campaigns via @sejournal, @zerobounce1

When you’re reaching out to a mass email list with your business offering, the last thing you want is to see that your last email blast didn’t make it to the full audience you aimed for.

These email bounces waste time and money. But that’s just the tip of the iceberg.

A bounce rate higher than 2% can shatter your entire email marketing strategy by sabotaging your email deliverability.

In fact, according to marketing standards, you want your bounce rate to be as close to 0% as possible and never more than 2%.

See how many bounces your next campaign may get >>>

The good news? You can take steps to avoid this common problem for good and calibrate your campaigns for better email deliverability.

Read on to find out how bounces hurt your business and what you can do today to boost your email marketing success.

What Is A Bounce Rate?

Your bounce rate is the percentage of emails you send that bounce or do not make it to a recipient’s inbox.

There are two types of bounces – hard bounces and soft bounces – and each has a different effect on your email marketing campaign.

In both cases, however, your message won’t make it to the intended recipient.

What Is A Hard Bounce?

A hard bounce indicates a permanent issue with the email address.

It’s invalid or possibly never existed.

There’s no hope of your email getting through with that address, so make sure to remove it from your email list.

What Is A Soft Bounce?

A soft bounce happens when a temporary issue causes your email to not be delivered.

The mailbox was full, your email was too large, or the domain was down. Your email provider will keep trying to deliver your message, but it may end up permanently bouncing.

Make sure to remove permanent bounces from your database.

What’s Wrong With Getting Email Bounces?

Getting bounces is antithetical to email marketing because you’re sending your emails because you want a real person to open and read them.

It’s frustrating and demoralizing when that doesn’t happen.

  • Bounces waste money. Email services charge based on the number of email addresses on your list, as well as how many emails you send. If you’re getting bounces, you’re pouring dollars down the drain.
  • Bounces waste time. Why would you put all of this work into your emails only to have them result in a pile of bounces?
  • Bounces affect your email deliverability. They send notice to Internet Service Providers (ISPs) that you’re likely a spammer and should be treated as such. Fewer people will see your emails because they’re now going to the junk folder.

Is It Possible To Have A 0% Bounce Rate?

Perfection is unattainable, but it is an ideal to strive for.

You may want to achieve a 0% bounce rate. However, there are many factors out of your control:

  • A Full Mailbox: Your customer may have a valid email address, but their mailbox is full. This will result in a soft bounce.
  • Issues With Email Providers: The contacts on your list rely on other email providers, so you can’t dictate what happens on their end.
  • Glitches: You’ve likely witnessed an email that bounced for no discernible reason. Sometimes an unexplained phenomenon or glitch is to blame.

Any of these may be the culprit for a bounce.

They’re why the expected email marketing bounce rate benchmark is 2%, but it’s also why your target should be to reach perfection – 0%.

The concept of “aim small, miss small” applies. If you shoot for 0%, you may get close.

If you try to hit the benchmark, you may veer into the danger zone.

How To Reduce Your Bounce Rate

Now that you know the risks of a high bounce rate, let’s explore the most reliable ways to keep bounces at bay and help your emails reach the inbox.

How To Reduce Your Email Bounce Rate & Boost Email Marketing CampaignsImage courtesy of ZeroBounce.Net, October 2023

Step 1: Validate Your Email List

You can remove invalid email addresses from your list once they bounce, but the damage is already done.

To keep your email deliverability high, you want to avoid bounces in the first place – and the most effective way to do it is by using an email validator.

An email validation service checks your email list for invalid email addresses so you can remove them before they cause harm.

The process is easy and fast – on average, you can verify 100,000 contacts in less than an hour.

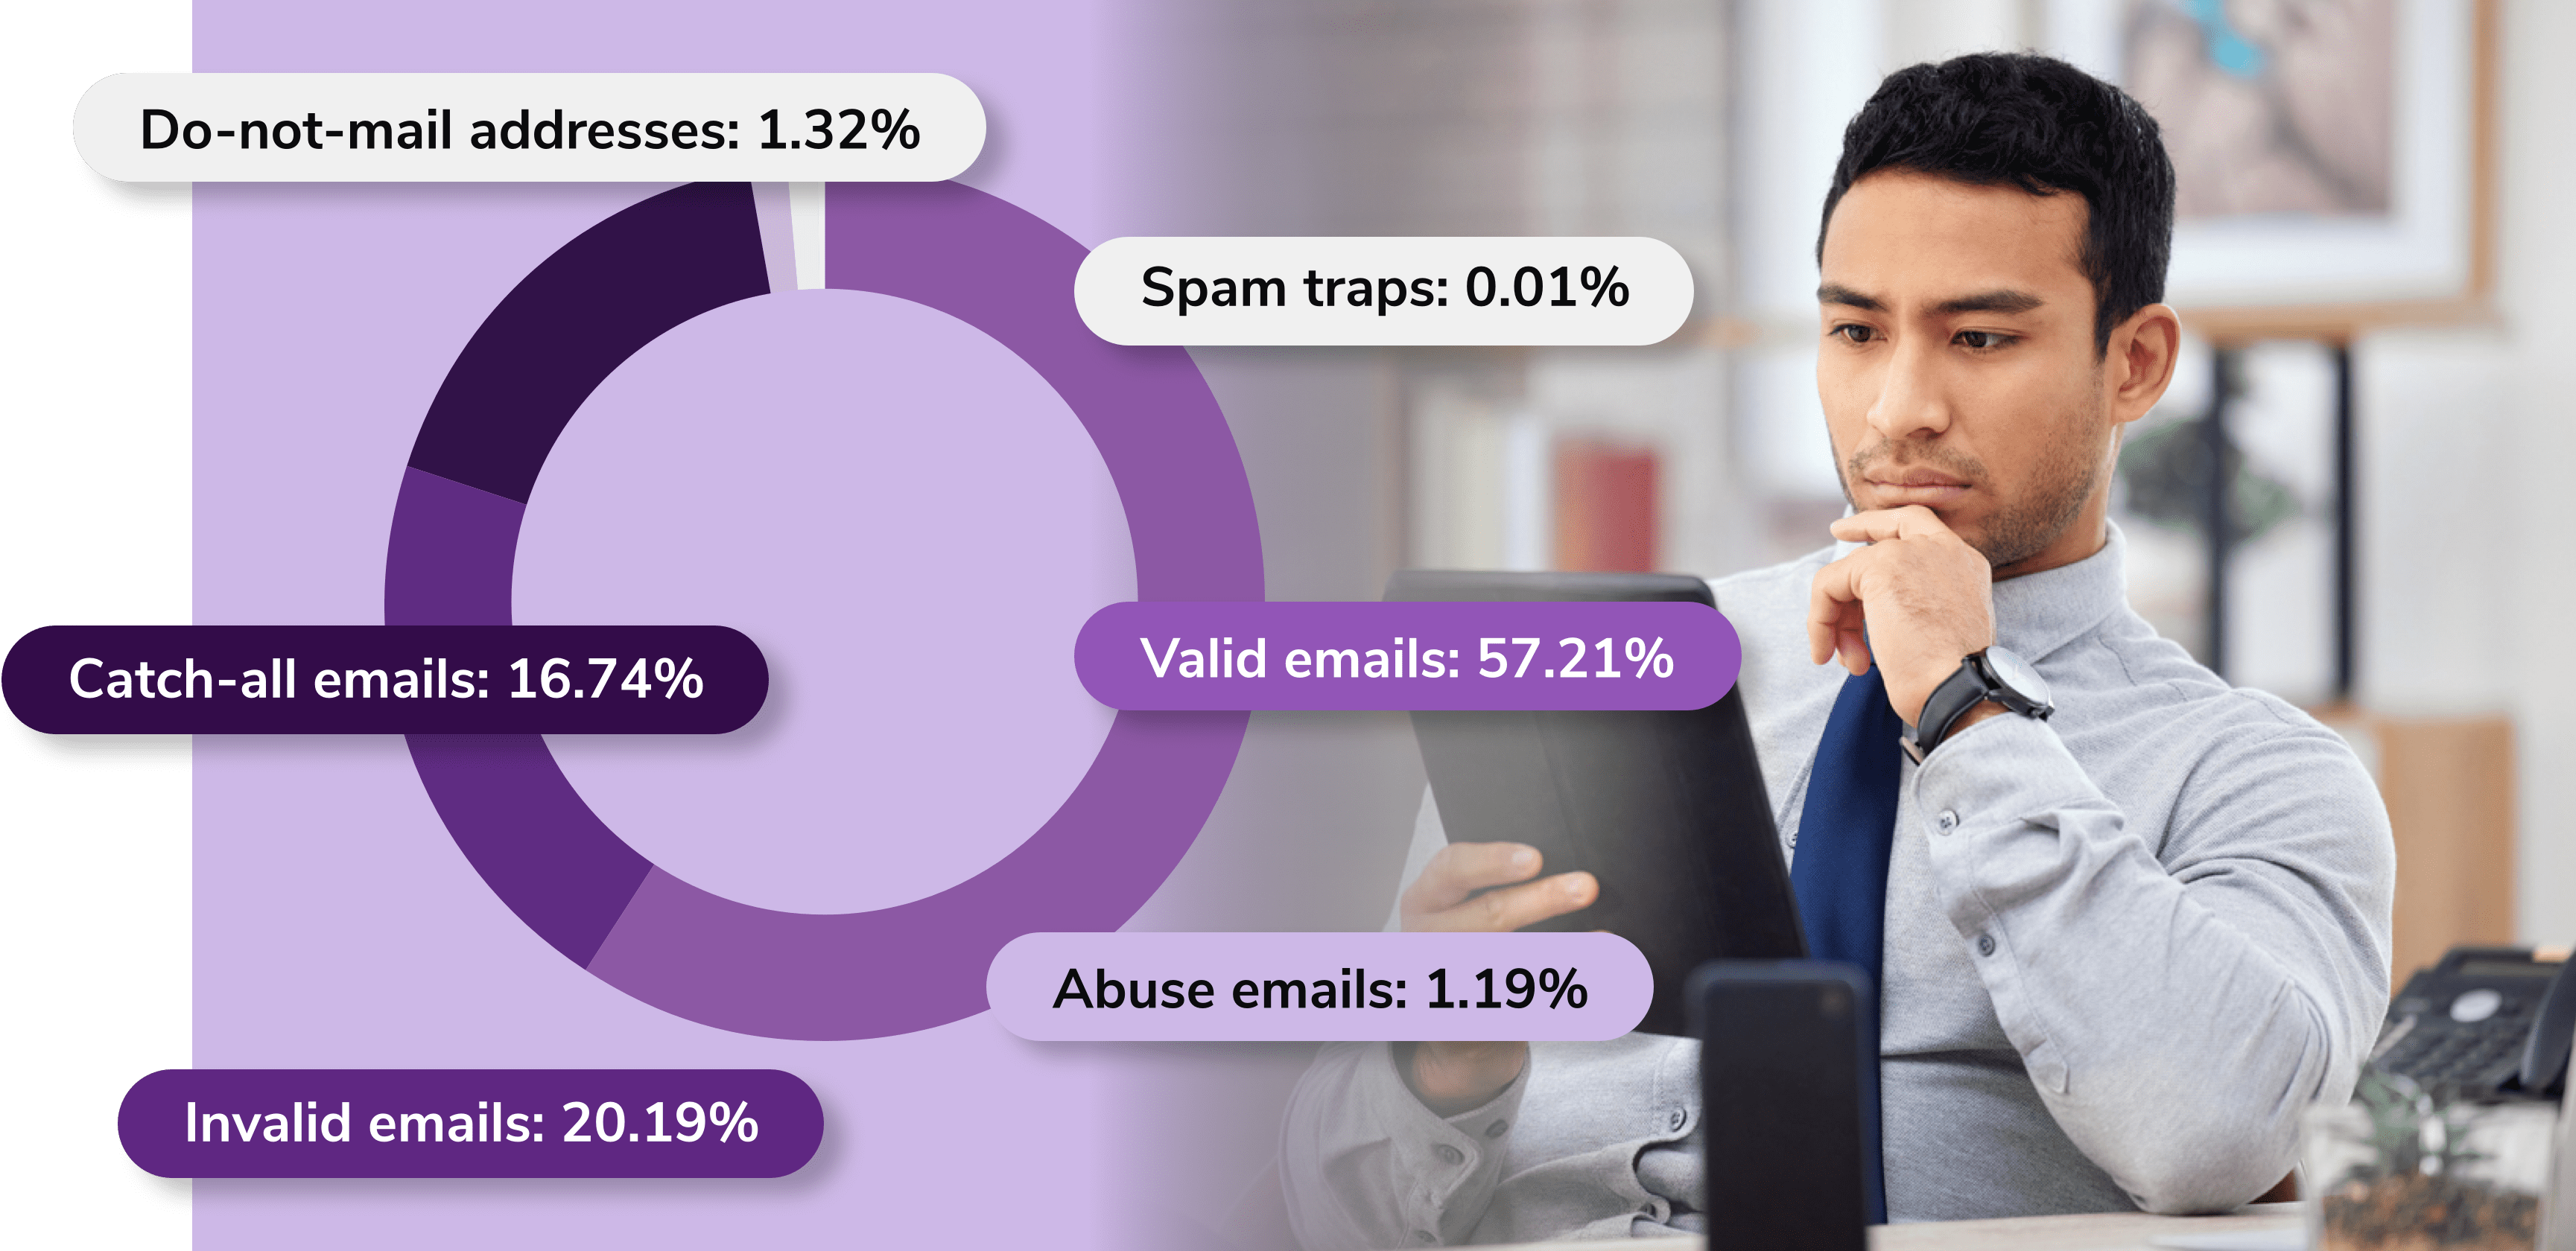
Email databases decay at an average rate of 23% a year, so remember to validate your contacts at least once a quarter.

How To Reduce Your Email Bounce Rate & Boost Email Marketing CampaignsImage courtesy of ZeroBounce.net, October 2023

Step 2: Set Up An Email Validation API

After you verify your entire email list, you can go a step further and prevent it from acquiring bad data with an email validation API.

The API is your second layer of defense against bounces, working in real-time to protect the health of your email list.

Once you connect the API to your sign-up and registration forms, it blocks invalid emails right at the point of capture.

For instance, if someone mistypes an email, it prompts them with a message asking them to enter the right address. Aside from that, a trustworthy email validation API blocks bots and fake sign-ups, thus protecting your email deliverability.

Step 3: Remove Unengaged Subscribers From Your Email List

Building an email list takes effort, so many companies want to hold on to the email contacts they gather.

The bigger your list, the higher the ROI is the common mindset.

Google Rolls Out Gmail Translation To Mobile Apps via @sejournal, @kristileilani

Google plans to update mobile apps with Gmail translation, improving global business and marketing communications.

  • Google has introduced native translation integration within the Gmail mobile app, extending the feature previously available on the web.
  • Users can now translate emails into over 100 languages on mobile devices through a new dismissible banner.
  • A gradual rollout has begun for Android, and will begin soon for iOS users.